Resource
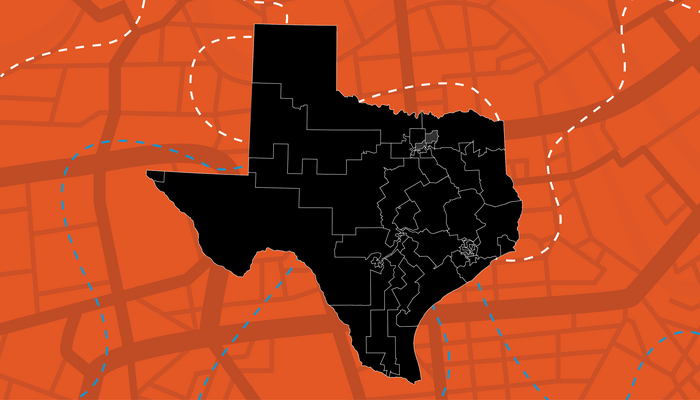
Texas Redistricting and Congressional Districts
Here’s how Texas’s demographics have changed since the last time maps were drawn — and what those changes mean for this decade’s redistricting cycle.


Part of
The Texas legislature has convened in a special session to pass new state legislative and congressional district maps. The purpose of this process is to account for population changes that have occurred over the past decade as measured by recently released 2020 Census data. In Texas, these changes have been significant, with the state’s population growing by 13.7 percent, from 25,145,561 to 29,145,505 people, between 2010 and 2020.
As in 2011, when districts were last drawn, Republican lawmakers in Texas have complete control over the process. But the legal landscape has shifted for the worse since then. Because a 2013 U.S. Supreme Court ruling struck down a key provision of the Voting Rights Act, for the first time in six decades Texas will no longer be required to obtain preapproval of maps from the U.S. Department of Justice or a federal court in Washington, DC, to ensure that they do not discriminate by race. And in a 2019 ruling, the Supreme Court also foreclosed the possibility that federal courts could serve as a backstop to partisan gerrymandering, no matter how brazen or extreme.
Thus, Texas’s 150 state house, 31 state senate, and 38 congressional districts are being drawn under single-party control without critical safeguards against racial discrimination or partisan abuses. This analysis summarizes Texas’s major population trends of the last decade, both statewide and in its major urban hubs, and examines their redistricting implications.
Highlights:
- Nonwhite Texans and those reporting two or more races collectively account for 95 percent of the 3,999,944 people that Texas added to its population between 2010 and 2020.
- The Latino population came within half a percentage point of surpassing the white population as the largest demographic group in Texas, adding a staggering 1,980,796 people over the decade.
- Eighty-six percent of Texas’s population gains are in and around three major metro areas — the Dallas–Fort Worth metroplex, Houston, and Austin–San Antonio. These rapidly expanding cities and their growing suburbs far outpaced the rest of Texas, and collectively they now have numbers to support four additional state house districts and two additional congressional districts.
- Of the 20 fastest-growing counties, 13 were suburban counties where the white share of the population decreased over the last decade by up to 16 percent.1 In recent years, nonwhite voters demonstrated an increased ability to influence elections in these suburbs. One issue to watch during Texas’s redistricting will be whether this growth translates into additional electoral opportunities for communities of color or whether the political establishment instead dilutes their growing political influence.
Statewide Analysis
Texas gained nearly 4 million new residents from 2010 to 2020, making it by far the fastest-growing state over the last decade.2 According to estimates from 2019, about half of this change is attributable to natural increase and half due to international immigration and domestic in-migration.3 As of 2019, California, Florida, and Georgia were the top states from which people moved to Texas, which is estimated to have gained more than 350,000 people from other states in that year alone.4
This substantial population growth was not distributed evenly across racial and ethnic groups. Latinos alone are responsible for 50 percent of all population gains in Texas over the past decade, adding nearly 2 million people and falling only half a percentage point short of becoming the largest ethnic group in the state. Texas’s Black and Asian populations, too, gained over half a million people each. This is in stark contrast to the moderate growth among Texas’s white population, which gained only 187,252 people in the last decade despite being the largest demographic group in the state.
These demographic trends hold when Texas’s citizen voting age population, which is often used in redistricting as a stand-in for eligible voters, is considered. More than half of the estimated increase in eligible voters from 2010 to 2019 were Latino, and communities of color more generally account for three-quarters of the increase.5
The story of Texas’s demographic change over the last decade also has a geographic component. Urban and suburban areas flourished, while rural areas and small towns held steady or shrank.
Three metro regions accounted for 86 percent of all population growth in the state: the Dallas–Fort Worth metroplex added 1,270,845 people; greater Houston, 1,201,824 people; and Austin–San Antonio, 955,835 people.6 Smaller cities contributed to the growth as well. The counties containing El Paso, Odessa, Laredo, Lubbock, and Corpus Christi all saw their numbers expand significantly.
Across the rest of the state, meanwhile, 143 rural counties saw their populations decrease. Though the losses were modest, collectively amounting to a decrease of 97,062 people, the trend underscores the need for representation to shift to cities and their suburbs.
Regional Analysis
Homing in on the urban areas that experienced the highest growth over the last decade puts a finer point on the statewide changes. The following maps show change in the nonwhite share of the population by census tract in the counties around Dallas–Forth Worth, Houston, and Austin–San Antonio. They reveal that the rapid growth of Texas’s booming suburbs has been driven by communities of color.
The Dallas–Fort Worth metro area grew more than any other Texas region from 2010 to 2020. Seventy-nine percent of that growth took place among the Black, Latino, and Asian communities. The region contains 4 of the 10 fastest-growing counties in Texas, with Tarrant County, home to Fort Worth, ranking second in the state in absolute gains, behind Harris County.
Suburban Collin and Denton Counties ranked fourth and seventh among Texas counties in terms of absolute growth and were responsible for 40 percent of the population gains in the Dallas–Fort Worth metroplex. Of that growth, 80 percent is attributable to people of color. Both counties, which were just over 60 percent white in 2010, are now among the most diverse in all of Texas, according to the Census Bureau’s new measure.7 Each is now within a few percentage points of becoming a racial plurality.8 The Black and Latino communities there grew significantly, and the Asian population grew at a breakneck pace, more than doubling since 2010.9
This demographic transformation of the Dallas–Fort Worth suburbs has been accompanied by economic and political changes. As Collin County’s population doubled since 2000, its population density increased by 30 percent and its employment expanded by 77 percent.10 Housing development, too, has soared as suburbs such as Frisco, Plano, and McKinney have grown explosively.11
The political winds have also shifted. Across Tarrant, Collin, and Denton Counties, multiracial coalitions are increasingly impacting the region’s politics.12 In 2020, an Afro-Latina candidate, Candace Valenzuela, came within a point and a half of winning a congressional seat in the suburbs of Dallas.13 The same year, Lulu Siekaly nearly became the first Arab American elected to Congress from Texas, largely by garnering large swaths of the Asian vote in Collin County.14
By the numbers, the fast-growing Dallas–Fort Worth counties should gain one and a third state house districts and over three-quarters of a congressional district from regions of the state that have shrunk or stagnated.15 Even within the metroplex, representation should follow the changes in population — Collin and Denton Counties have grown relative to others and now have the population to support one and a half additional state house districts and half an additional congressional seat.

Looking at greater Houston, a similar story emerges. The region gained 1.2 million people from 2010 to 2020, largely in Harris, Fort Bend, and Montgomery Counties. Harris County alone was responsible for 16 percent of the state’s population growth during this period.
The Latino, Black, and Asian communities were collectively responsible for the majority of increases in each of the Houston area’s counties, respectively making up 48, 18, and 17 percent of total gains. In four counties, including Harris County itself, the white population decreased. This means that the 638,686-person increase in Houston’s population is entirely attributable to growth among people of color.
Houston’s growth has been outpaced by that of suburban counties such as Fort Bend, which saw its population increase by 41 percent, largely driven by nonwhite communities. Indeed, changes in the Latino, Asian, and Black populations there collectively account for 85 percent of growth. While many counties saw their Latino numbers rise the most, in Fort Bend, Asian communities anchored the gains. Fort Bend is now 30 percent white, 24 percent Latino, 22 percent Asian, 20 percent Black, and 3 percent multiracial. It has become the most diverse county in Texas.16 This demographic evolution has coincided with a political one: in 2018, Fort Bend elected KP George, an Indian American, as its county executive. He is the first person of color to hold the post.17 And after voting Republican for over a decade, Fort Bend has swung blue in every major election since 2016.18
Likewise, suburban Montgomery County grew at double the rate of Harris County. It remains far less diverse than Fort Bend, at 60 percent white, 26 percent Latino, 5 percent Black, 3 percent Asian, and 4 percent multiracial. But Montgomery County’s Asian, Black, and Latino populations grew by 129, 84, and 73 percent respectively, far exceeding the white population’s 14 percent increase. These demographic trends suggest that Montgomery County will soon become a racial plurality as well.
Given this decade’s changes, the Houston metro area now has the population to sustain an additional one and a third state house districts and an additional eight-tenths of a congressional district. Fort Bend County alone can now comfortably support four state house districts, and it should see the greatest gains in representation.19
The Austin–San Antonio corridor has been called “the next mega metro” of Texas, and its growth this decade supports the title.20 The state capital and San Antonio have long been connected by Interstate 35. More recently, the two cities have grown toward each other, forming an expansive metro area that rivals the Dallas–Fort Worth metroplex and greater Houston.
Overall, Austin–San Antonio gained 955,835 people over the last decade. Latinos led among ethnic groups, adding 408,653 people, 43 percent of the area’s growth. Bexar, Travis, and Williamson led among the region’s counties and experienced the third, fifth, and ninth highest population growth among all counties in the state.
As with Texas’s other metro areas, growth in the Austin–San Antonio corridor was driven by growth among the Black, Latino, and Asian communities, which constitutes 61 percent of all added population. In Bexar County, which contains San Antonio, the Latino community accounted for 60 percent of increases. Across demographic categories, just over half of Bexar County’s new population moved there, and the rest were new births.21
By contrast, corridor counties still early in their development — Hays and Comal, for example — received the bulk of their population growth from people moving in, as previously open land has been rapidly converted to new housing for Austin and San Antonio commuters.22 These counties grew at the fastest rates statewide, increasing by about 50 percent each. North of Austin, Williamson County trailed just behind with a 44 percent increase. Just under three-quarters of its added population moved from elsewhere in the United States.23
With this rapid growth, however, come pains. The displacement of longtime Black and Latino residents in greater Austin led the city to create a community displacement prevention officer position to mitigate gentrification’s effects.24 Infrastructure, too, has been buckling due to the region’s population explosion. With 28.9 million miles traveled daily by Bexar County drivers alone, roads in the region have become congested.25
But from a redistricting standpoint, things are clear: like the other major metro areas in Texas, Austin–San Antonio should see additional representation in state and federal government. Based on population, the region can support nearly two additional state house seats and three-quarters of an additional congressional seat.26
Conclusion
Texas’s growth over the last decade has been staggering and almost entirely driven by people of color. At stake in this redistricting cycle is the political power of the growing Latino, Black, and Asian communities in Texas’s rapidly diversifying cities and suburbs. Whether they receive the representational gains that should result from their increases — or whether they instead see their political power diluted by gerrymandering — remains to be seen.
Endnotes
-
1
Of the thirteen suburban counties that added the most people from 2010 to 2020, the white share of total population decreased by 4.7–15.9 percent. White people no longer make up the majority in three of these counties and dropped below 55 percent of the population in an additional five counties. -
2
2020 U.S. Census PL 94–171 redistricting data summary files and 2010 U.S. Census data show that Texas added the most people of all states between 2010 and 2020. U.S. Census Bureau 2020 Census PL 94–171 Redistricting Summary File, https://www.census.gov/programs-surveys/decennial-census/about/rdo/summary-files/2020.html and 2010 Census Summary File 1 Data, https://www.census.gov/data/datasets/2010/dec/summary-file-1.html. -
3
Natural increase is estimated to be responsible for 1,871,086 of the 3,849,790 people added to Texas’s population between 2010 and 2019, accounting for 49 percent of the state’s growth. The Census Bureau estimated a net migration of 1,964,386 people to Texas from 2010 to 2019, accounting for 51 percent of its estimated growth over that time period. Of in-migrants, 58 percent moved from elsewhere in the United States and 41 percent immigrated from abroad. U.S. Census Bureau, “Table 4. Cumulative Estimates of Resident Population Change of the United States, Regions, State, and Puerto Rico,” available at https://www.census.gov/data/tables/time-series/demo/popest/2010s-state-total.html. -
4
U.S. Census Bureau, “Table 1. State-to-State Migration Flows: 2019,” from the 2019 American Community Survey 1-Year Estimates, https://www.census.gov/data/tables/time-series/demo/geographic-mobility/state-to-state-migration.html. -
5
According to Census Bureau estimates, Latinos made up 53 percent of the added citizen voting age population in Texas; Black people, 15 percent; Asians, 8.7 percent; and non-Hispanic white people, 19.3 percent. U.S. Census Bureau, “Citizen Voting-Age Population Special Tabulation,” from the 2019 American Community Survey 5-Year Estimates, https://www.census.gov/programs-surveys/decennial-census/about/voting-rights/cvap.2019.html. -
6
We use the Census Bureau’s Dallas–Fort Worth–Arlington and Houston–The Woodlands–Sugarland metropolitan statistical areas to define the scope of relevant counties in those regions. We use the Greater Austin–San Antonio Corridor Council’s list of included counties to define the Austin–San Antonio region. Greater Austin–San Antonio Corridor Council, “Counties & Cities,” accessed August 30, 2021, https://www.thecorridor.org/counties-and-cities. -
7
U.S. Census Bureau, “Racial and Ethnic Diversity in the United States: 2010 and 2020 Census,” August 12, 2021, https://www.census.gov/library/visualizations/interactive/racial-and-ethnic-diversity-in-the-united-states-2010-and-2020-census.html; Pamela Gwyn Kripke, “Why 30,000 Chinese People Call Plano Home,” D Magazine, June 2012, https://www.dmagazine.com/publications/d-magazine/2012/june/why-30000-chinese-people-call-plano-texas-home/; and Meredith Yeomans, “Indian Population Finds Welcoming Home in Collin County,” NBC DFW, November 16, 2016, https://www.nbcdfw.com/news/local/indian-population-finds-welcoming-home-in-collin-county/153292/. With the 2020 Census Redistricting File, the Census Bureau released a series of data visualizations capturing the racial and ethnic diversity in the United States over the previous decade. Included in those analyses was a diversity index. Information about the bureau’s novel diversity measures can be found at “Measuring Racial and Ethnic Diversity for the 2020 Census,” August 4, 2021, https://www.census.gov/newsroom/blogs/random-samplings/2021/08/measuring-racial-ethnic-diversity-2020-census.html. -
8
In 2020, Collin County was 51 percent white and Denton County was 53 percent white, down from 63 percent and 64 percent in 2010, respectively. -
9
Indeed, Collin County added the most Asian Americans of any county in Texas (101,089 people), more than counties triple its size in Houston and elsewhere. -
10
U.S. Census Bureau, “Quick Facts – Collin County, TX,” https://www.census.gov/quickfacts/collincountytexas; and Collin County, TX, “The Numbers,” accessed September 28, 2021, https://www.collincountytx.gov/living/Pages/numbers.aspx -
11
Claire Ballor, “Collin County Is Far Outpacing Surrounding Counties When It Comes to New Single-Family Homes,” Dallas Business Journal, October 9, 2018, https://www.bizjournals.com/dallas/news/2018/10/09/collin-county-is-far-outpacing-surrounding.html; and Bruce Tomaso, “Across the Country, Suburbs Like Plano Are Successfully Challenging Urban Centers for Growth,” Dallas Morning News, July 18, 2018, https://www.dallasnews.com/opinion/commentary/2018/07/18/across-the-country-suburbs-like-plano-are-successfully-challenging-urban-centers-for-growth/. -
12
The tense fight over a school diversity plan in the Dallas suburb of Southlake has garnered national attention. Mike Hixenbaugh and Antonia Hylton, “Inside Southlake: Texas Suburb at Center of a Critical Race Theory Battle Looks Forward,” CBS News, August 30, 2021, https://www.nbcnews.com/news/us-news/inside-southlake-texas-suburb-center-critical-race-theory-battle-looks-n1277748. -
13
Akela Lacy, “Candace Valenzuela Narrowly Loses Race Against ‘Anti-Sharia’ Republican in Dallas Suburbs,” The Intercept, November 3, 2020, https://theintercept.com/2020/11/03/candace-valenzuela-texas-congress/. -
14
Amal Ahmed, “Lulu Seikaly Wants to Flip One of Texas’ Most Conservative Suburban Districts,” Texas Observer, October 15, 2020, https://www.texasobserver.org/lulu-seikaly-wants-to-flip-one-of-texas-most-conservative-suburban-districts/. -
15
Ideal district population sizes are calculated by dividing the total population of Texas (25,145,561 in 2010 and 29,145,505 in 2020) by the number of Texas districts in the relevant category (150 for state house, 31 for state senate, and 38 for Congress). The ideal size for a state house district was 167,637 in 2010 and 194,303 in 2020; for a state senate district, 811,147 in 2010 and 940,178 in 2020; and for a congressional district, 698,488in 2010 (when the state had only 36 seats) and 766,987 in 2020. Collin County, for example, would have been entitled to 4.6 state house districts in 2010 and has the population for 5.47 state house districts in 2020, meaning the number of districts it could support increased by 0.8 over the past decade due to population growth. Combined figures for the Dallas–Fort Worth region were calculated by adding these county representational differences together. -
16
U.S. Census Bureau, “Racial and Ethnic Diversity in the United States.” -
17
Lisa Gray, “Indian-American K.P. George Takes Historic Place as Fort Bend County Judge, Houston Chronicle, December 20, 2018, https://www.chron.com/news/houston-texas/houston/article/Indian-American-K-P-George-takes-historic-place-13498873.php. -
18
Juan Pablo Garnham, “Democrats Didn’t Get a Blue Wave, but Some of the Fastest-Growing Suburbs in Texas Are Still Moving to the Left,” Texas Tribune, November 11, 2020, https://www.texastribune.org/2020/11/11/texas-democrats-republicans-suburb/. -
19
By our estimates, Fort Bend’s state house representational share increased from 3.49 in 2010 to 4.23 in 2020. Montgomery County’s share increased from 2.72 to 3.19. -
20
Mike Marut, “State Demographer Believes Austin-San Antonio Could Be Next ‘Mega Metro’ Area Based on Census Data,” KVUE, August 14, 2021, https://www.kvue.com/article/money/economy/boomtown-2040/census-state-demographer-believes-austin-san-antonio-could-be-next-mega-metro-area/269–0321750c-0cab-4218–948c-6a51072709c4. -
21
U.S. Census Bureau, “Estimates of the Components of Resident Population Change for Counties: April 1, 2010 to July 1, 2019,” accessed September 28, 2021, https://www.census.gov/data/datasets/time-series/demo/popest/2010s-counties-total.html -
22
U.S. Census Bureau, “Estimates of the Components of Resident Population Change”; and Jackie Wang, “Census: Bexar County Growth Among Largest in Nation from 2010 to 2019,” San Antonio Report, March 26, 2020, https://sanantonioreport.org/census-bexar-county-growth-among-largest-in-nation-from-2010-to-2019/. -
23
U.S. Census Bureau estimates attribute around 90 percent of estimated growth in Comal County and around 80 percent of estimated growth in Hays County to migration, in both cases overwhelmingly from within the United States. 72 percent of population gains in Williamson County were new movers from elsewhere in the United States. U.S. Census Bureau, “Estimates of the Components of Resident Population Change.” -
24
City of Austin, “City of Austin Hires First Community Displacement Prevention Officer,” April 14, 2021, https://www.austintexas.gov/news/city-austin-hires-first-community-displacement-prevention-officer. -
25
Tara Petitt, “Traffic Inbox: Could San Antonio’s Traffic Congestion Cripple the City?,” Spectrum News 1, June 11, 2019, https://spectrumlocalnews.com/tx/san-antonio/traffic/2019/06/11/could-san-antonio-s-traffic-congestion-cripple-the-city—. -
26
By our estimates, the Austin–San Antonio corridor counties can support 1.91 more state house districts and 0.77 more of a congressional district. Travis and Williamson Counties saw an increase of 0.21 and 0.18 of a congressional seat, respectively.
More from the Redistricting and Changing Demographics in Key States series
-
Florida Redistricting and Congressional Districts
Here’s how Florida’s demographics have changed since the last time maps were drawn — and what those changes mean for this decade’s redistricting cycle. -
Georgia Redistricting and Congressional Districts
Here’s how Georgia’s demographics have changed since the last time maps were drawn — and what those changes mean for this decade’s redistricting cycle. -
North Carolina Redistricting and Congressional Districts
Here’s how North Carolina’s demographics have changed since the last time maps were drawn — and what those changes mean for this decade’s redistricting cycle.


Stay up to date