North Carolina Redistricting and Congressional Districts
Here’s how North Carolina’s demographics have changed since the last time maps were drawn — and what those changes mean for this decade’s redistricting cycle.

Part of
In the coming weeks, the North Carolina legislature is expected to pass new state legislative and congressional district maps. The purpose of this process is to account for population changes that have occurred over the past decade as measured by recently released 2020 Census data. In North Carolina, these changes have been significant, with the state’s population growing by 9.5 percent, from 9,535,483 to 10,439,388 people, between 2010 and 2020.
As in 2011, when districts were last drawn, Republican lawmakers in North Carolina will have complete control over the process. Under the North Carolina Constitution, Gov. Roy Cooper, a Democrat, does not have the power to veto maps passed by the legislature. But the legal landscape has shifted since then. Because of a 2013 Supreme Court ruling striking down a key provision of the Voting Rights Act, for the first time in six decades the state no longer needs to obtain preapproval of maps from the U.S. Department of Justice or a federal court in Washington, DC, to ensure they do not discriminate by race. Forty North Carolina counties were previously covered by the law. And in a 2019 ruling, the Supreme Court also foreclosed the possibility that federal courts could serve as a backstop to partisan gerrymandering, no matter how brazen or extreme. But North Carolina state courts struck down both congressional and legislative maps last decade as partisan gerrymanders that violated the state’s constitution.
Thus, North Carolina’s 120 state house, 50 state senate, and 14 congressional districts are being drawn under single-party control with a state law framework that has gotten better and a federal one that has gotten worse. This analysis summarizes North Carolina’s major population trends of the last decade, both statewide and in its fast-growing metro areas, and examines their redistricting implications.
Highlights:
- Black, Latino, Asian, and multiracial North Carolinians collectively account for nearly 90 percent of the 903,905 people that the state added to its population between 2010 and 2020. Nearly all of this growth was among adults.1
- Almost 50 percent of North Carolina’s population gains are concentrated in just two counties: Mecklenburg County in the Charlotte metro area and Wake County in the Research Triangle region. These two counties far outpaced all others in terms of growth, and they now have numbers to support increased representation, including nearly three additional state house districts.2
- Two interrelated issues to watch will be the extent to which this growth translates into additional electoral opportunities for communities of color, which accounted for almost all of the state’s net population growth, and whether the residents of fast-growing Mecklenburg and Wake Counties — both Democratic strongholds — receive increased representation.
Statewide Analysis
North Carolina gained over 900,000 new residents over the course of the decade, ranking sixth among all states in total population growth.3 This growth was not evenly spread across the state, with a number of counties in eastern North Carolina and other rural regions seeing their populations stagnate or decrease. According to estimates from 2019, about one-third of this growth is attributable to natural increase4 and two-thirds due to people moving to North Carolina, either from other parts of the United States or from abroad.5
Notably, North Carolina had the third-highest level of domestic in-migration of all states, behind only Florida and Texas. People have moved to the state from U.S. cities including New York, Atlanta, Washington, Miami, Philadelphia, and Chicago.6 As a result, the state’s population change since 2010 has been mostly driven by growth of the adult population, with many coming to metro Charlotte and the Research Triangle as college students, academics, or professionals. Others move to North Carolina for retirement, seeking to be closer to their adult children or attracted by the mild climate and comparatively affordable real estate prices.7
The state’s substantial population growth was not distributed equally across racial and ethnic groups. Increases among Black, Latino, Asian, and multiracial North Carolinians represented 88 percent of overall growth. The Latino and Asian populations grew faster than others, collectively accounting for 50 percent of the total growth despite making up just 14 percent of the state’s overall population. The white and Black populations grew more slowly over the past decade, with each responsible for about 10 percent of the state’s overall gains. Still, they remain the two biggest demographic groups in absolute terms.
This variable growth across racial and ethnic groups has changed the overall demographic breakdown of the state. Latino communities have grown to roughly 11 percent of the population, a share that is consequential for redistricting. Meanwhile, the white population in North Carolina has dropped significantly, to 60 percent of the total, and the Black population has decreased modestly, to 20 percent.
New statistical measures compiled by the Census Bureau further underscore North Carolina’s racial and ethnic diversity. There is now a 57.9 percent chance that two people chosen at random in North Carolina would be from different racial or ethnic groups, up from 52.1 percent in 2010.8
Because North Carolina’s population growth is largely concentrated in urban and suburban geographic pockets, these areas have the population to support more districts. Indeed, over the last decade, many rural counties saw their population numbers fall or hold steady. Among areas that lost residents, 23 rural counties saw net population decreases of over 1,000 people. Meanwhile, areas around greater Greensboro saw healthy increases, and the populations of metro Charlotte and the Research Triangle boomed.
Collectively, metro Charlotte and the Research Triangle added nearly 740,000 people, accounting for just over 80 percent of North Carolina’s total population growth over the decade. By the numbers, these fast-growing areas should pull almost two state senate districts, more than four state house districts, and nearly a full congressional district from regions of the state where the population has shrunk or stagnated.9
Regional Analysis
Taking a closer look at counties in metro Charlotte and the Research Triangle puts a finer point on the statewide trends. Unsurprisingly, the growth of Black, Latino, Asian, and multiracial communities has exceeded that of the white population in these burgeoning regions, now home to more than 40 percent of North Carolinians.

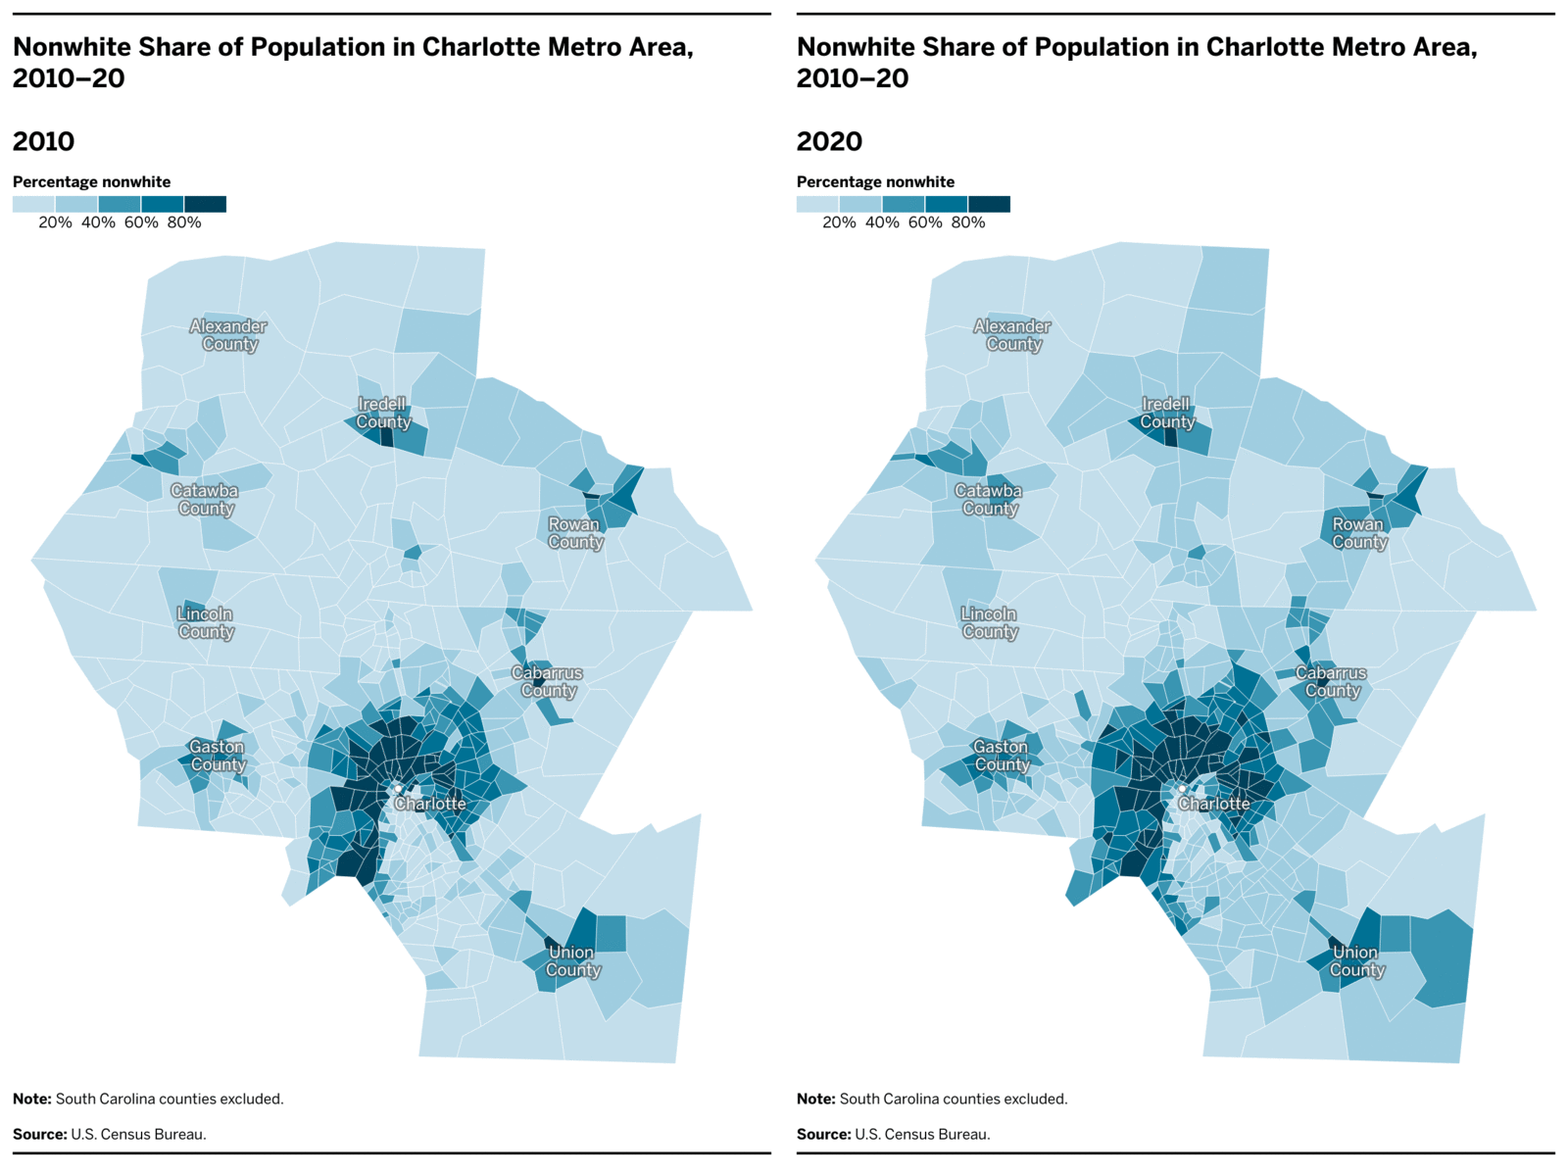
A major trend of the last decade is the rapid growth of Black, Asian, Latino, and multiracial communities in suburbs of Charlotte and adjacent exurban counties. The region has seen 45 percent of the state’s Black population growth, 37 percent of its Asian growth, 32 percent of its Latino growth, and 24 percent of its multiracial growth. The above map, which shows change in the nonwhite share of the population by census tract from 2010 to 2020, reveals how metro Charlotte has grown more diverse outside of its urban center over the past decade.

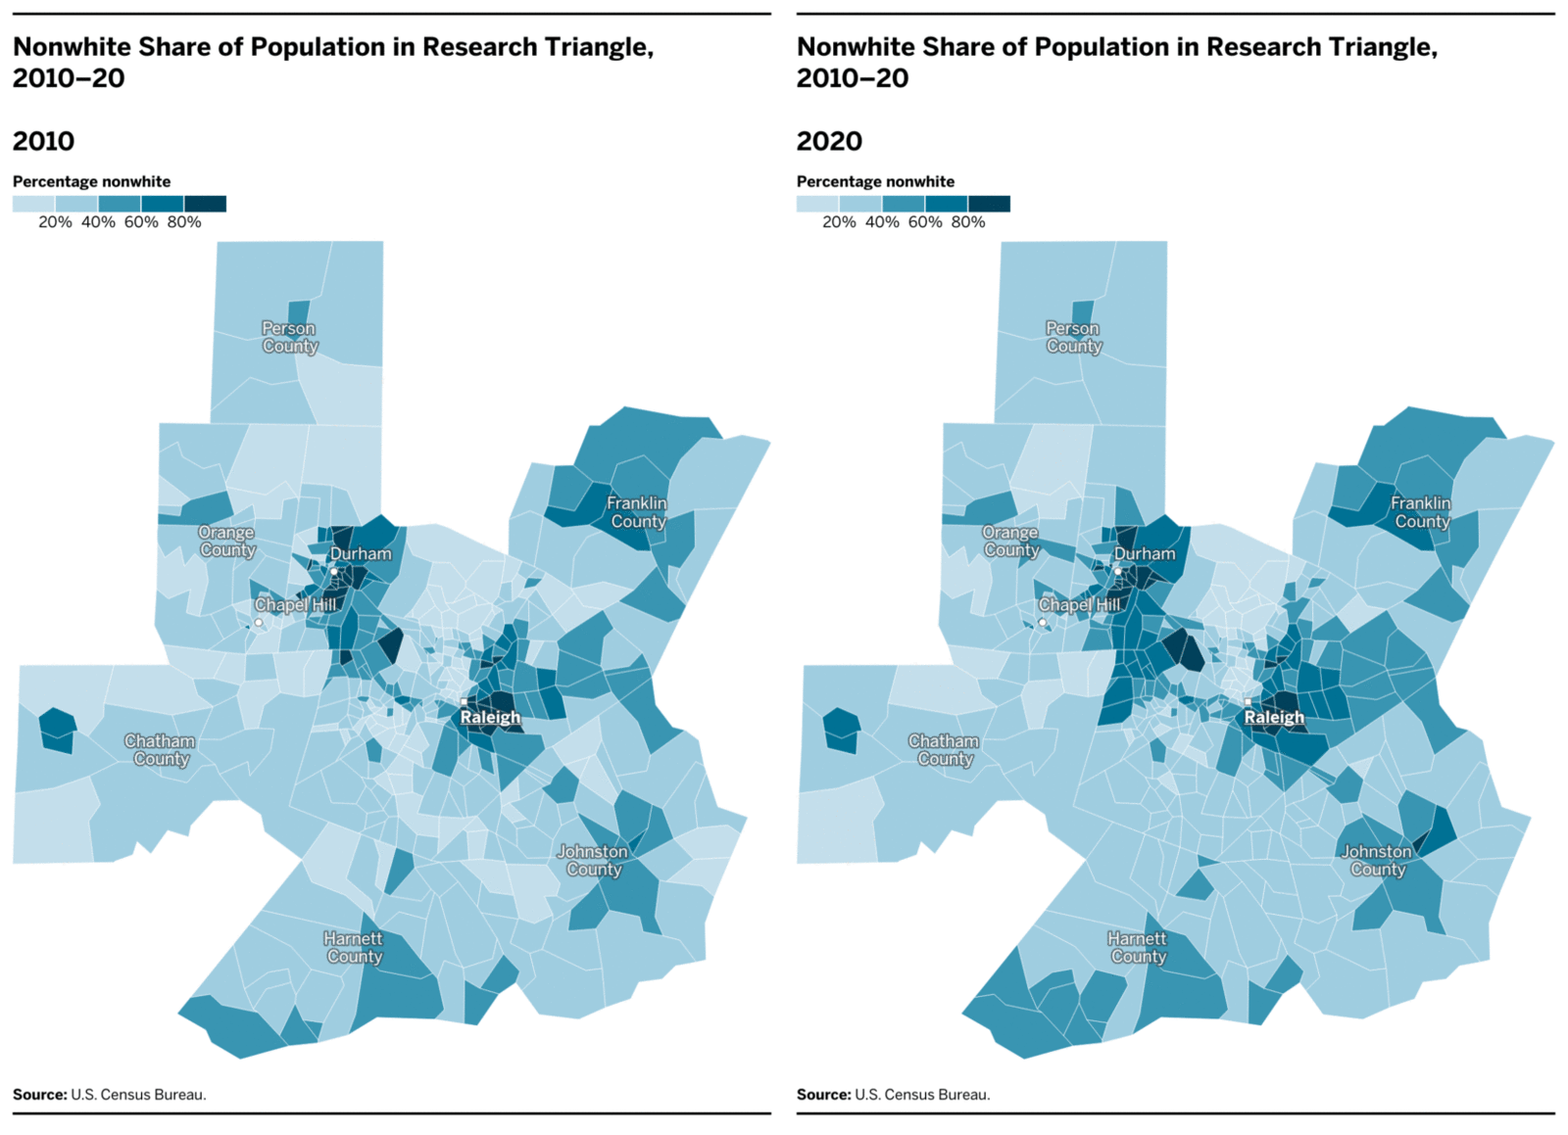
Like metro Charlotte, the Research Triangle, which includes the cities of Raleigh, Durham, and Chapel Hill, also hosts a large portion of North Carolina’s growing nonwhite communities. Indeed, 24 percent of the state’s Black population growth, 44 percent of its Asian growth, 26 percent of its Latino growth, and 22 percent of its multiracial growth is concentrated here. The suburban and exurban areas bordering both Mecklenburg and Wake Counties saw strong population increases in the latter years of the 2010s, after experiencing stagnation or decline in the wake of the 2008 recession.10
Many of those coming to metro Charlotte and the Research Triangle are Black young professionals or retirees who are part of the reverse Great Migration — a return to the South by the descendants of Black people who fled discrimination to pursue opportunities in other parts of the country.11 North Carolina now draws Black college graduates and has become the third most popular state for Black retirees, behind only Florida and Georgia.
Immigration has also been a significant driver of growth in metro Charlotte and the Research Triangle. For example, as of 2019, over 15 percent of Mecklenburg County residents were born in another country, with 5 percent of residents having come to the United States since 2010.12 These domestic and international migration patterns have contributed to the growth of nonwhite populations in metro Charlotte and the Research Triangle.
These demographic trends have had political consequences. At the local level since 2017, Charlotte elected its first Black woman mayor, Durham elected its first Latina city council member, and Cary, a town in Wake County, elected its first Asian woman to its town council.13 Black sheriffs were elected in each of North Carolina’s seven largest counties in 2018, and in another, Pitt County, a Black woman was elected sheriff — a first for the state.14 There have also been firsts for state government. In 2020, Alamance County elected the first Latino Democrat to serve in the North Carolina General Assembly.15
These successes have coincided with organizers’ recent efforts to turn out Latino and Asian voters, who have not traditionally voted at the same rates as their Black and white counterparts.16 As the Latino and Asian communities continue their rapid growth and the Black population remains a significant presence, communities of color in North Carolina have numbers to command more representation. But this growing political power could meet with backlash and discriminatory districting.
Conclusion
North Carolina’s population has undergone a profound evolution over the last decade. Whether redistricting will account for this significant population growth and diversification, especially in metro Charlotte and the Research Triangle, will be key to understanding the electoral landscape in North Carolina.
Endnotes
-
1
Rebecca Tippett, “NC Growth over Last Decade Entirely from Adult Population,” Carolina Demography, August 16, 2021, https://www.ncdemography.org/2021/08/16/nc-growth-over-last-decade-entirely-from-adult-population/. -
2
Based on population growth over the last decade, Wake County should receive roughly 70 percent of an additional state senate district, 1.65 state house districts, and 29 percent of a congressional district. Mecklenburg County should receive roughly an additional 50 percent of a state senate district, 1.25 state house districts, and 24 percent of a congressional district. -
3
2020 U.S. Census PL 94–171 redistricting data summary files and 2010 U.S. Census data show that North Carolina added the sixth most people of all states between 2010 and 2020, trailing only Texas, Florida, California, Georgia, and Washington. North Carolina ranks 16th in relative population growth. -
4
Total population growth in North Carolina from 2010 to 2019 was estimated at 952,333, with the natural increase estimated at 307,836. U.S. Census Bureau, “Table 4. Cumulative Estimates of Resident Population Change of the United States, Regions, State, and Puerto Rico” and “Region and State Rankings: April 1, 2010 to July 1, 2010,” December 2019, available at https://www.census.gov/data/tables/time-series/demo/popest/2010s-state-total.html. -
5
Population growth in North Carolina from 2010 to 2019 due to international immigration was estimated at 163,662, and change due to domestic in-migration was estimated at 475,508. North Carolina ranked 15th nationwide in international immigration. U.S. Census Bureau, “Cumulative Estimates.” In 2019, Florida, Virginia, South Carolina, New York, Georgia, California, and New Jersey were the top senders of population to North Carolina. U.S. Census Bureau, “Table 1. State-to-State Migration Flows: 2019,” from the 2019 American Community Survey 1-Year Estimates, https://www.census.gov/data/tables/time-series/demo/geographic-mobility/state-to-state-migration.html. -
6
U.S. Census Bureau, “Metro Area-to-Metro Area Migration Flows,” from the 2018 American Community Survey 5-Year Estimates, https://www.census.gov/data/tables/2018/demo/geographic-mobility/metro-to-metro-migration.html. -
7
Gary D. Robertson, “Population Growth Gives North Carolina a 14th US House Seat,” Associated Press, April 26, 2021 https://apnews.com/article/census-2020-north-carolina-government-and-politics-224115e6f12d0c44c464a18ffbedf7c5. -
8
North Carolina ranked 19th among all states for diversity in both 2010 and 2020. U.S. Census Bureau, “Racial and Ethnic Diversity in the United States: 2010 Census and 2020 Census,” August 12, 2021, https://www.census.gov/library/visualizations/interactive/racial-and-ethnic-diversity-in-the-united-states-2010-and-2020-census.html. -
9
Based on population growth between 2010 and 2020, metro Charlotte counties should be afforded an additional 75 percent of a state senate district, 1.8 state house districts, and 43 percent of a congressional district. Research Triangle counties should be afforded an additional 1.1 state senate districts, more than 2.5 state house districts, and 48 percent of a congressional district. -
10
Robertson, “Population Growth Gives North Carolina a 14th US House Seat.” -
11
Tim Spears, “North Carolina Benefits from Reverse Great Migration,” Spectrum News 1, March 11, 2021, https://spectrumlocalnews.com/nc/charlotte/news/2021/03/11/north-carolina-benefits-from-reverse-great-migration; Greg Toppo and Paul Overberg, “After Nearly 100 Years, Great Migration Begins Reversal,” USA Today, updated March 18, 2015, https://www.usatoday.com/story/news/nation/2015/02/02/census-great-migration-reversal/21818127/; and “Why Some Black Millennials Are Moving South,” WBUR, August 8, 2017, https://www.wbur.org/hereandnow/2017/08/08/black-millennials-moving-south. -
12
U.S. Census Bureau, “Foreign Born Data Tables,” from the 2019 American Community Survey 5-Year Estimates, https://www.census.gov/topics/population/foreign-born/data/tables/acs-tables.html. -
13
Brandon Carter, “Charlotte, N.C., Elects Its First Female African American Mayor,” The Hill, November 7, 2017, https://thehill.com/blogs/blog-briefing-room/news/359315-charlotte-elects-its-first-female-african-american-mayor; Dawn Baumgartner Vaughan, “New Durham City Council Member Is 1st Latina,” Herald Sun, January 17, 2018, https://www.heraldsun.com/news/local/counties/durham-county/article194985904.html; and Amber Keister, “Meet Ya Liu,” Cary Magazine, July 13, 2020, https://www.carymagazine.com/features/meet-ya-liu/. -
14
Joe Killian, “Black Sheriffs Make History in Sweep of Seven Largest NC Counties,” NC Policy Watch, November 8, 2018, http://www.ncpolicywatch.com/2018/11/08/black-sheriffs-make-history-in-sweep-of-seven-largest-nc-counties/. -
15
Elizabeth Pattman, “Ricky Hurtado Becomes First Latino Democrat Elected to N.C. General Assembly,” Times-News (Burlington, NC), November 19, 2020, https://www.thetimesnews.com/story/news/local/2020/11/19/ricky-hurtado-first-latino-democrat-nc-general-assembly/6338135002/. -
16
Brittny Mejia, “Can Democrats Turn North Carolina Blue? Latinos May Hold the Answer,” Los Angeles Times, October 12, 2020, https://www.latimes.com/politics/story/2020–10–12/latino-vote-north-carolina-presidential-battleground; and Chris Kromm, “Energized Asian-American Voters Could Play Key Role in N.C. Elections,” Facing South, October 26, 2018, https://www.facingsouth.org/2018/10/energized-asian-american-voters-could-play-key-role-nc-elections.
More from the Redistricting and Changing Demographics in Key States series
-
Texas Redistricting and Congressional Districts
Here’s how Texas’s demographics have changed since the last time maps were drawn — and what those changes mean for this decade’s redistricting cycle. -
Florida Redistricting and Congressional Districts
Here’s how Florida’s demographics have changed since the last time maps were drawn — and what those changes mean for this decade’s redistricting cycle. -
Georgia Redistricting and Congressional Districts
Here’s how Georgia’s demographics have changed since the last time maps were drawn — and what those changes mean for this decade’s redistricting cycle.


