
On June 9, voters in Georgia cast their ballots in the presidential local primary contests as well as two seats for the state supreme court. In the lead-up to the contest, we analyzed discrepancies in who was requesting mail absentee ballots. Past research had indicated that racial minorities were less likely to request mail ballots than other voters in Georgia. We showed that, at least in Georgia, those trends held true even during a pandemic when all voters were sent absentee ballot request forms.
In this analysis, we examined data from the Georgia primary, covering 129 of 159 counties, to discover why — and whose — mail ballots are rejected as well as which voters took advantage of early in-person options. We found that:
- A much smaller share of white voters had their mail ballots rejected than nonwhite voters.
- For all racial groups, most rejected ballots were rejected because they were received after the deadline.
- Black voters were more likely to vote early and in person than white voters.
- More than 8 percent of voters who requested mail ballots voted in person. This was especially common among Black voters.
During our analysis, we discovered that the state misreported some absentee ballot rejections. As such, the findings presented below exclude counties we have reason to believe had erroneous data. A discussion of these limitations and how we dealt with them can be found at this bottom of this piece.
How Did Voters Participate?1
In the figure below, we break out how participants of different racial and ethnic groups cast their ballots in the 2020 presidential primary. More than half of all ballots were cast by mail — an enormous increase over the 2016 general election, when just 5.2 percent of voters voted by mail.
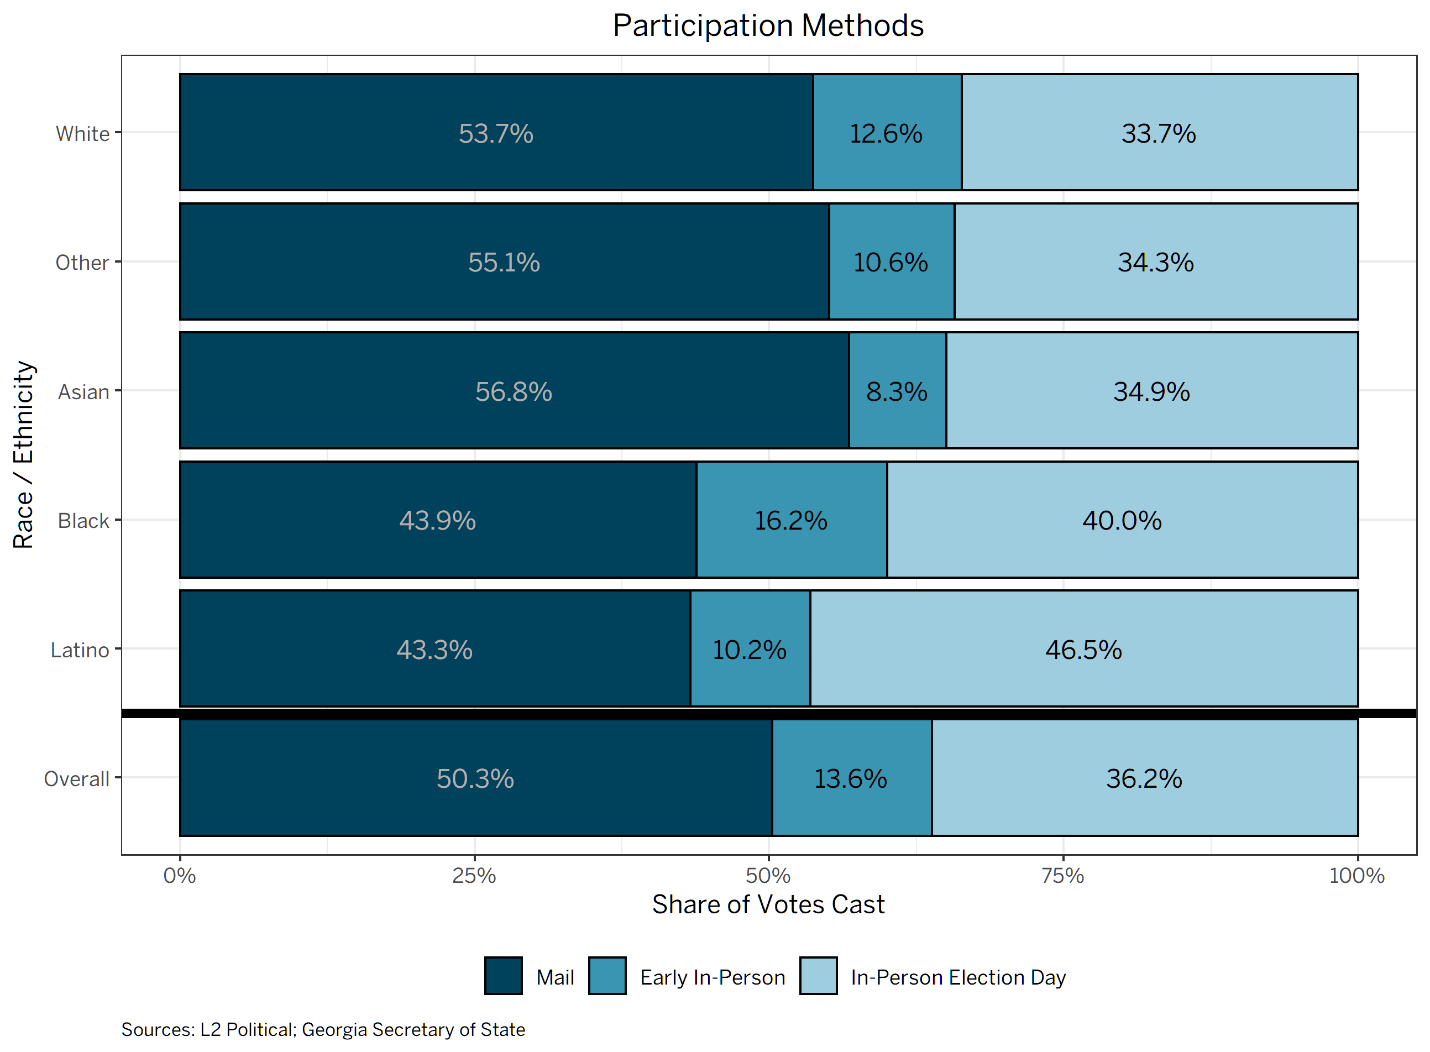
Although considerably fewer Black voters voted by mail than white voters, a larger share of them took advantage of early in-person voting. This increase, however, was not enough to offset the lower mail ballot usage: although just 33.7 percent of white voters cast their ballots in person on election day, 40 percent of Black voters did so.
Mail Ballot Rejection Rates
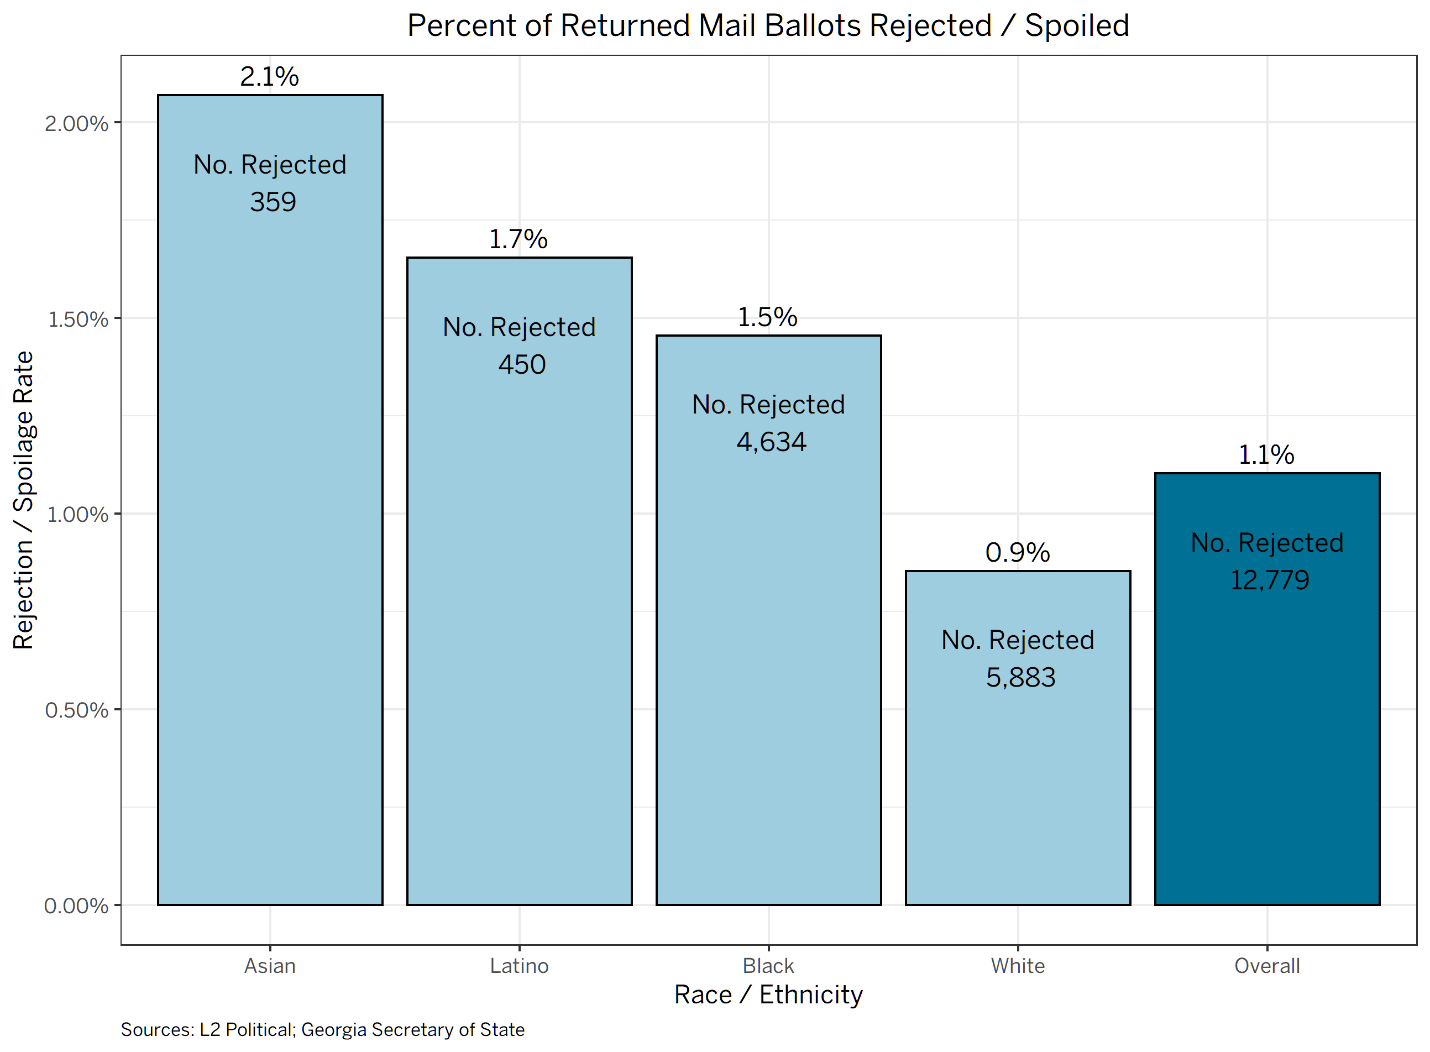
The figure below shows the share of returned mail ballots that were either rejected or marked as spoiled.
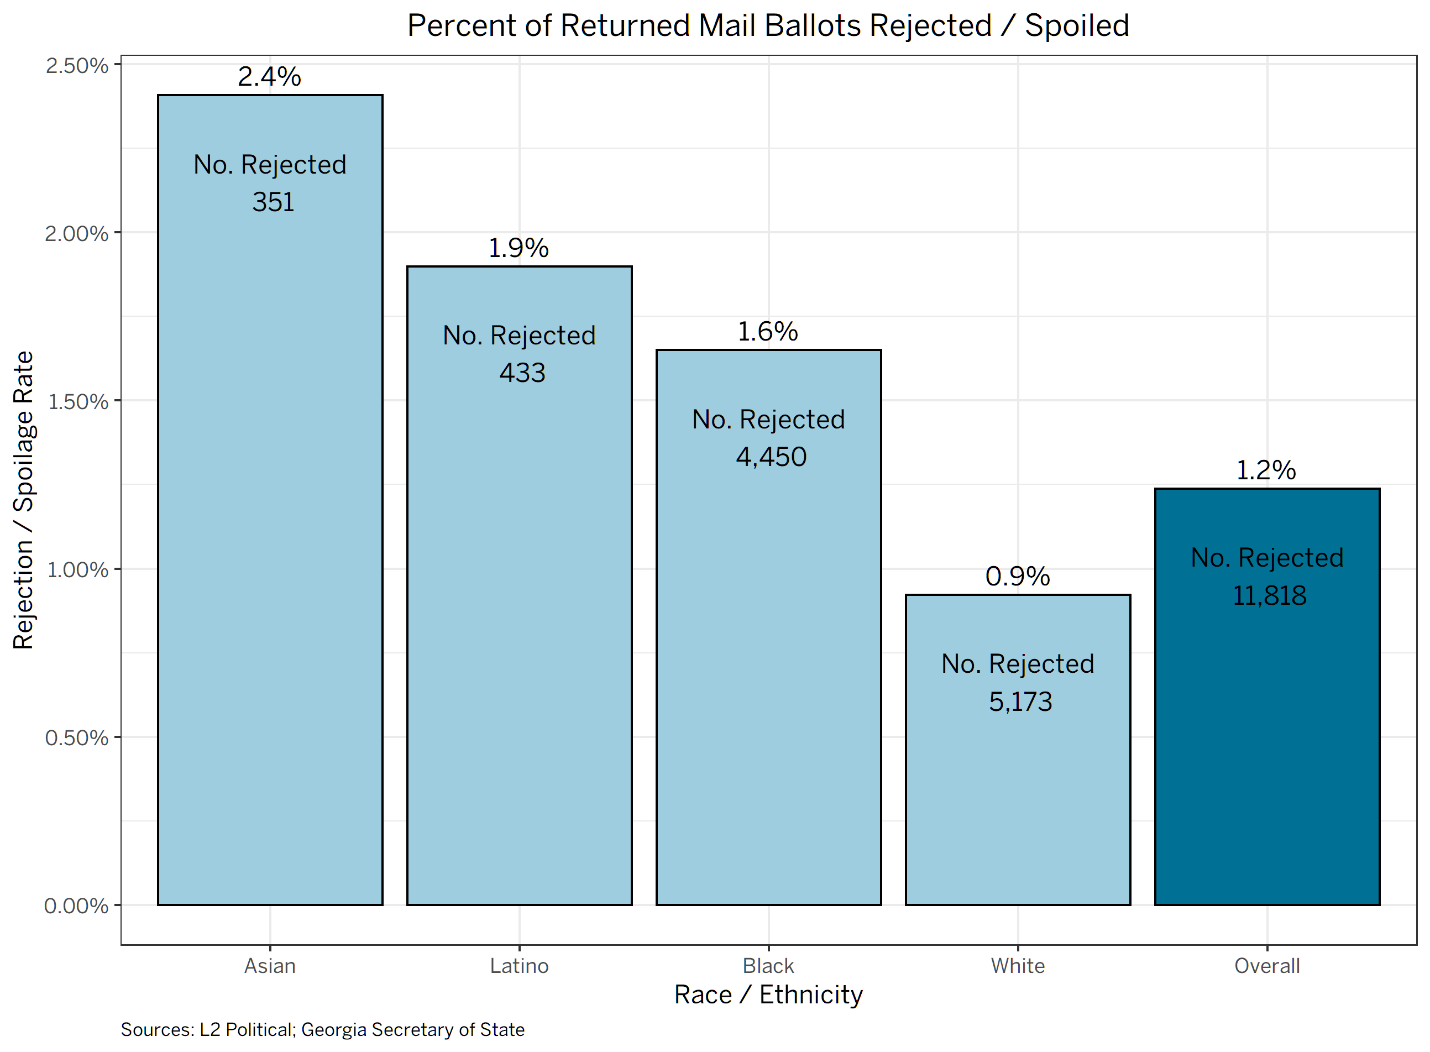
Although 1.2 percent of mail ballots overall were rejected, there are substantial differences by race. Just 0.9 percent of mail ballots cast by white voters were rejected, but mail ballots cast by Black, Latino, and Asian voters saw rejection rates of 1.6, 1.9, and 2.4 percent. These discrepancies are troubling, and election administrators should work to understand what is driving them.
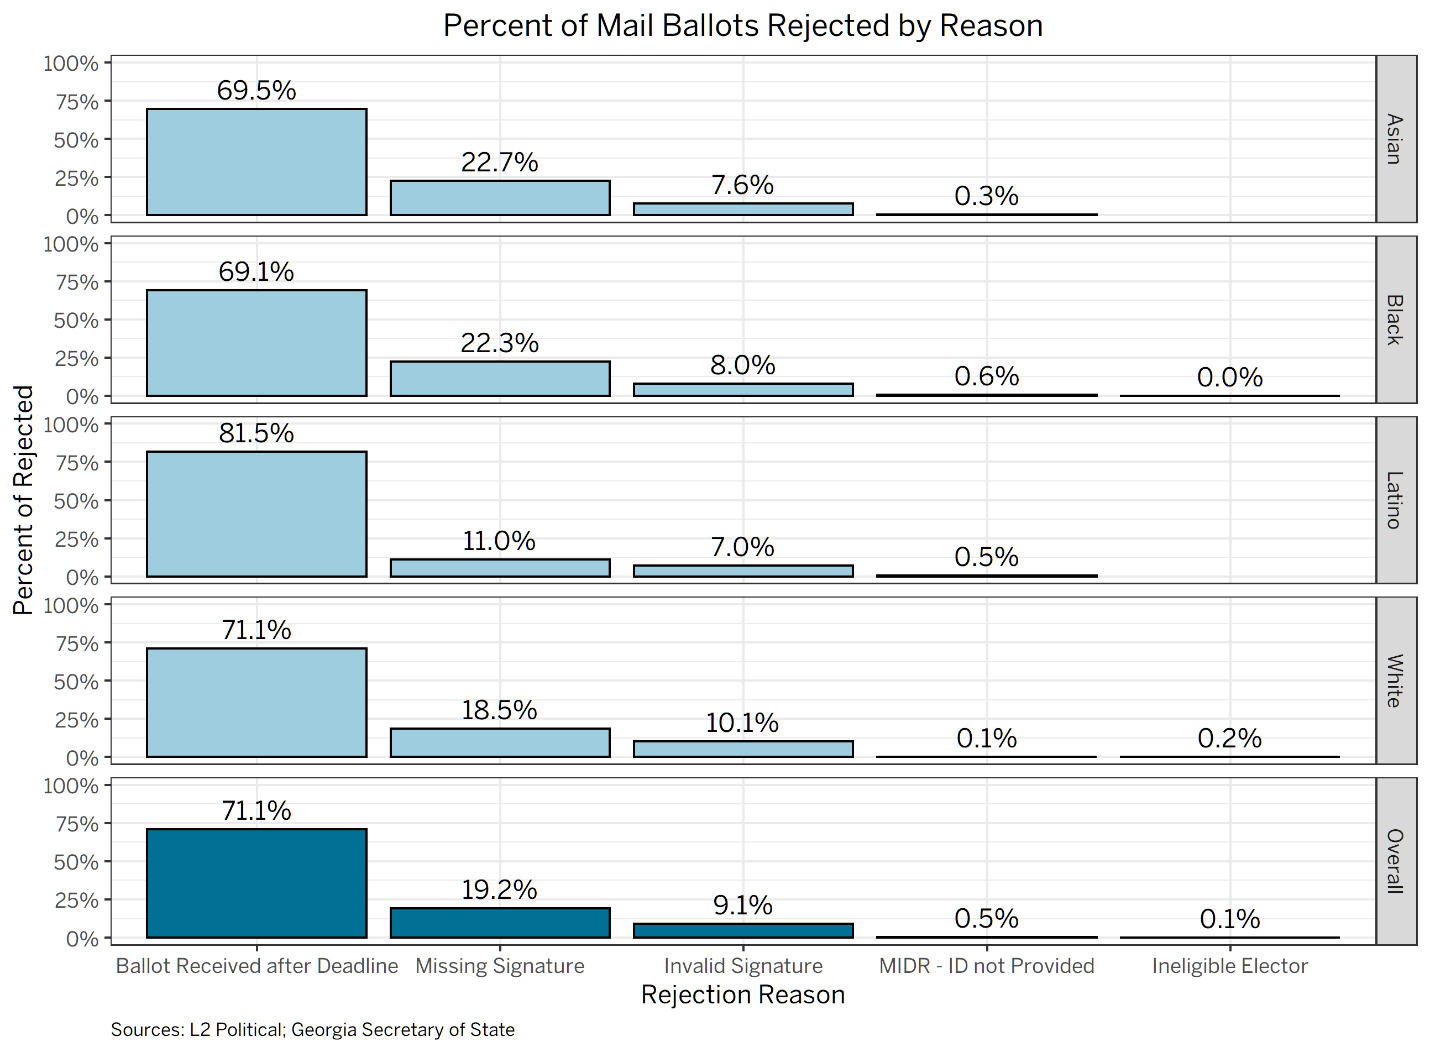
As the figure below shows, mail ballots were rejected for different reasons for voters among different racial and ethnic groups. One thing, however, stands out clearly: more than 70 percent of all ballots rejected were rejected because they were returned late. After late returns, missing signatures were the most common rejection reason for each group.
This points to the need for better advocacy about when mail ballots need to be returned. There were also stories before the election about major backlogs in parts of the state like Fulton County, potentially delaying when voters received their ballots. Election administrators must make sure that ballots are sent out early enough that voters have a chance to fill them out, mail them, and have them received by administrators in time to be counted.
Who Voted in Person?
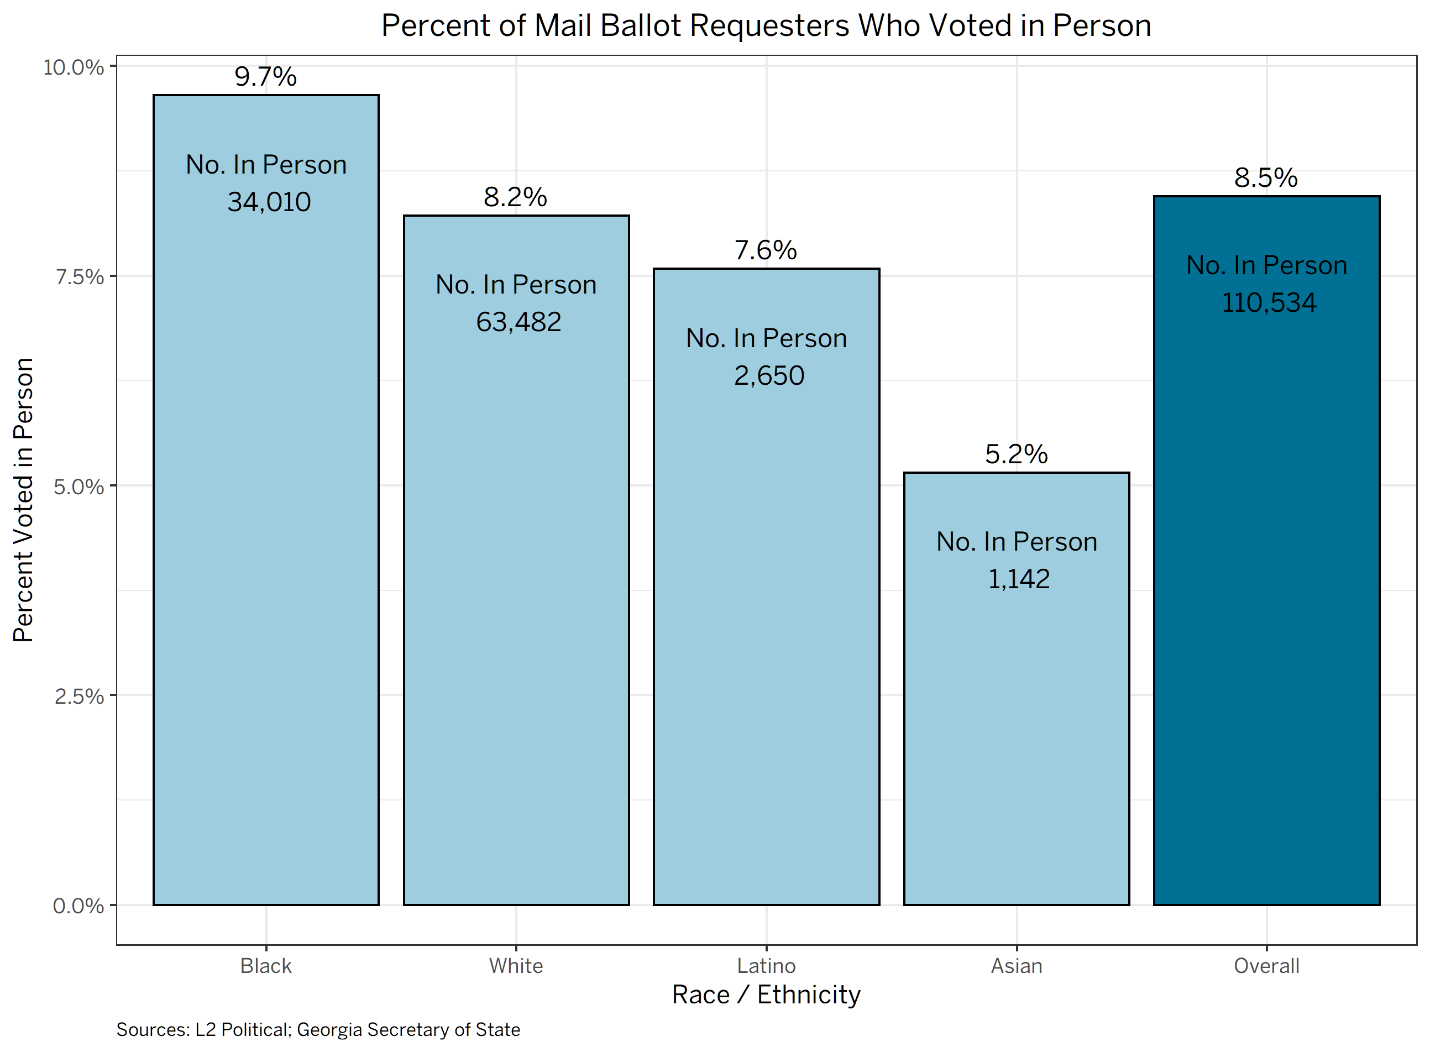
The figure below demonstrates that more than 110,000 voters who requested mail ballots eventually voted in person. This was especially common among Black voters. It is unclear why so many people who requested mail ballots chose to vote in another way. They may have been nervous about receiving their mail ballot in time to cast it; they may have never received their ballot at all; or they may have simply chosen to vote a different way. Advocates should consider reaching out to some of these voters to understand why they made their decision. If there were racial disparities in who never received a mail ballot, this needs to be addressed.
Conclusion
Past research indicates that voters of color are more likely to have their mail ballots rejected. It was unclear if those historical trends would continue in the context of a pandemic, when so many more voters cast mail ballots. Evidence from Georgia indicates that these disparities are in fact continuing. Black voters’ mail ballot rejection rate was almost double those of white voters.
Across the board, nearly three-quarters of rejected ballots were rejected because they were returned late. As the United States Postal Service grapples with severe funding shortages, the threat of mail delays and late-returned ballots is only likely to grow this November. Election administrators must deliver ballots to voters early enough that the can be returned in time, and the federal government must adequately fund the USPS so that it can deliver ballots (both to and from voters) in a timely manner.
Finally, administrators cannot simply focus on vote by mail while ignoring the importance on in-person options. A smaller share of nonwhite voters used vote by mail in the primary, indicating that these voters would be disproportionately harmed by shifting resources away from in-person options. A larger share of racial minorities used early in-person options than white voters, indicating that there are safe alternatives to election-day voting for these voters. Election administrators should be sure to provide them in safe and healthy options.
Data Issues
This analysis was originally published using the data available from the Georgia secretary of state’s website. Analyzing that data, we concluded that nonwhite voters had their mail ballots rejected at a higher rate than white voters; that most ballots were rejected because they were received after the deadline; that Black voters were more likely to vote early and in person than white voters; and that 9 percent of voters who requested mail ballots ended up voting in person, and this was more common among Black voters.
Our original analysis has been updated because there were reports that the data on the state website was not entirely reliable. Our revised findings, after adjusting for errors in the state’s data, look essentially the same as the original.
There were 50 counties that reported rejecting no absentee ballots because they arrived late. Because Fulton County acknowledged that the ballots that were rejected because they arrived late are not noted in the data provided by the secretary of state, we decided to dig into this issue. We called each of the counties where the state’s data indicates that no ballots were rejected because they arrived late.
We were able to speak with representatives from 38 of the 50 counties. Of these 38 counties, 17 told us that some rejected ballots were not included in the state’s data — indicating that the data from the state should not be accepted as is. Twenty-one of these counties, however, told us that the data was correct and that they had received no ballots after the deadline.
This modified analysis excludes the counties that confirmed their data was incorrect. To avoid accidentally including erroneous data, we also exclude the counties we were unable to contact. We also remove Polk County, which identified all absentee ballots that were not returned as “rejected.” Overall, this analysis includes counties that are home to more than 80 percent of Georgia’s voters.
Again, the exclusion of these counties does not appear to have a meaningful impact on the racial rejection gap. Below, we present the rejection rates when we accept the state’s data “as-is,” even though we know it has some errors. The racial rejection gap narrows very slightly. The rejection rate for white voters was 0.9 percent under both scenarios, but the rejection rate for Black voters increased from 1.5 percent to 1.6 percent when we excluded these counties. This is probably because we excluded Fulton County, which undercounted absentee rejections and is home to many Black voters.
It is also unlikely that the exclusion of these counties is artificially creating a racial rejection gap. If we assume that the mail ballot rejection rate was 1.6 percent for Black voters in these counties (the same as the rest of the state), they would have needed to reject more than 4.8 percent of white voters’ mail ballots — more than five times the rate at which the rest of the state rejected these ballots — in order for the rejection rate gap to disappear.
Endnotes
-
1
As in our last analysis, we rely here on data from L2 Political and the Secretary of State’s office. By linking these two data sources, we can identify the racial characteristics of voters who requested and cast mail absentee ballots.