
Please see the update at the bottom of this page for the final mail ballot request figures.
Georgia’s presidential primary is currently scheduled for June 9 after the state postponed it twice due to the pandemic. In addition to the presidential and local primaries, Georgians will vote for two seats on the state’s supreme court.
As the state and its voters prepare for the upcoming election, one thing is abundantly clear: mail voting will play a much larger role in this year’s primary than it ever has in Georgia. In late April, all registered voters in the state were sent mail ballot request forms. According to data from the secretary of state, as of May 19, the state had processed nearly 1.5 million absentee ballot requests. In 2016’s presidential primary, only 45,000 Georgia voters had requested absentee ballots. To put those numbers in context, 21.4 percent of registered voters in Georgia have already requested a mail ballot for the 2020 primaries, whereas it was under 1 percent in the 2016 primaries.
Our analysis of the absentee ballot data in Georgia indicates that as of today, there are real racial, age, and party disparities in the state as to who is requesting mail ballots. There are, however, some important caveats to the analysis that follows.
First, many applications have yet to be processed as county election administrators deal with the deluge of requests. Applications that are submitted, but not yet processed and accepted, will not be reflected in these numbers. This backlog could be obscuring trends in request rates. 1 Nevertheless, a processing backlog is concerning in its own right, especially as we get close to an election. Further analysis should be performed after the backlog is cleared.
Second, it is also possible that these trends would shift some naturally in the coming weeks. In 2016, for instance, our analysis shows that Democrats requested their mail ballots slightly later than Republicans (though they never reached parity).
Finally, these trends can change. Indeed, we believe and hope that the disparities can be reduced in response to mobilization strategies, public education, and policy changes.
Given these unique features, it is unclear how much the Georgia experience reveals about mail ballot usage in other states.
Who has requested mail ballots? 2
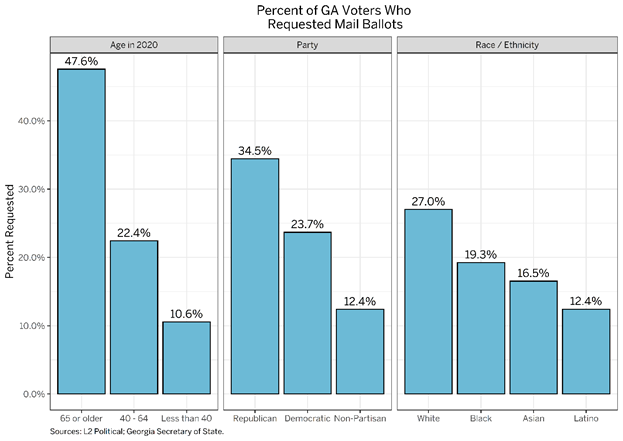
The data to date shows that 25.4 percent of white 3 voters have requested mail ballots, while just 17 percent of Black voters and 11.2 percent of Latino voters have requested these ballots.
There are also major discrepancies in age and party: statewide, 44.7 percent of voters 65 and older have successfully requested mail ballots already — but barely 9 percent of voters under the age of 40 have done so. Substantially more Republicans have requested mail ballots than Democrats. See the figure below.
 Brennan Center
A map of the counties makes clear that many voters in some parts of the state have requested mail ballots, while others are lagging. In Fulton County — the state’s largest and home to Atlanta — just 15.2 percent of registered voters had requested mail ballots as of May 19. In the figure below, we also show Georgia’s five largest cities for geographical reference.
 Brennan Center
Who is requesting mail ballots for the first time?
Some of this can be explained by longstanding patterns: older voters and white voters, for instance, generally use mail-balloting options more than younger and nonwhite voters. We would therefore expect to see higher request rates from these voters, even if no one was changing their behavior. But we are also interested in who is turning to mail voting after not using the option in past elections.
To understand which voters are shifting their behavior, we limit the following analyses to voters who were eligible to vote in the 2016 presidential primary but did not request a mail ballot. By looking at the behavior in 2020 of voters who could have voted by mail in 2016, but chose not to, gives us insight into how voters’ behavior is changing in the Peach State this year.
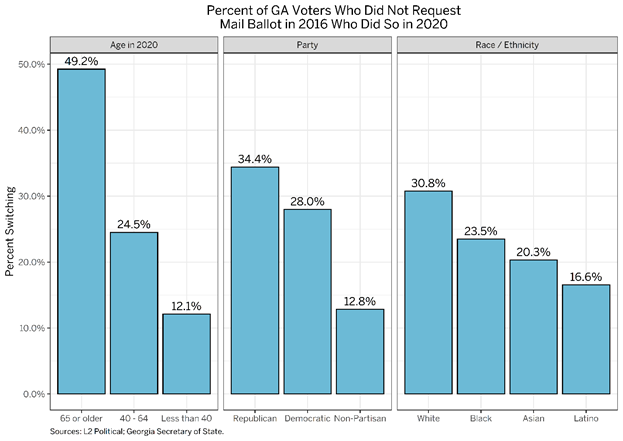
More than one out of every four voters who did not request a mail ballot in the 2016 presidential primary has done so in 2020. 4 Once again we see major racial discrepancies: 29 percent of white voters who didn’t request a mail ballot in 2016 have done so to date, while just 20.8 percent of Black voters have done so. This figure drops to just 15.1 percent for Latino voters.
 Brennan Center
Not only are white voters more likely to use mail voting overall, but this data from Georgia also indicates that white voters who did not use mail options in 2016 are switching their behavior at higher rates than nonwhite voters. The same is true for Republican voters: 32.7 percent of Republicans who did not vote by mail in 2016 have already requested a mail ballot this year, while 25.2 percent of such Democrats have done so. As the figure demonstrates, older voters are also shifting at far higher rates than younger voters.
Once again, we see evident geographic clustering. In Fulton County, just 18.6 percent of registered voters who did not request a mail ballot in 2016 have successfully done so this year. That number rises to more than one in three in 16 smaller counties.
 Brennan Center
Conclusion
Election administrators and advocates in Georgia should be mindful of the disparities in mail ballot requests by taking three related steps:
- Aggressively educate the public about the availability of vote by mail, with a specific emphasis in communities that are most at risk from Covid-19 or traditionally have low-usage rates of vote by mail. Reporting makes clear that the COVID-19 crisis in Georgia is concentrated in communities of color — communities that are requesting mail ballots at lower rates than white communities.
- Allocate sufficient resources to process mail ballot requests. As we approach the Georgia contest and the November elections, delays in processing will reduce the amount of time voters have to complete and mail their ballots.
- Ensure that sufficient numbers of safe and sanitary polling places remain open on Election Day. The data so far indicates that some voters are disinclined to use vote by mail. We must therefore ensure that voters who will not vote by mail still have an opportunity to have their voices heard.
Update on 6/10/2020
We reran this analysis the day after the Georgia primary to see if our findings held in the final weeks leading up to the election. We found that very little had changed from three weeks ago: white voters, Republicans, and older voters all ultimately requested absentee ballots at substantially higher rates than other groups. Although some of this can be explained by general turnout patterns in primary contests, the differences are large.
 Brennan Center
These same groups were also more likely to transition to mail ballots after not using the option in 2016. Among Black voters who could have used vote by mail in 2016 but did not, 23.5 percent requested absentee ballots this year. That share for white voters, however, was 30.8 percent.
 Brennan Center
We do not yet know what share of individuals who actually voted in each group voted by mail versus in person but will publish that information shortly after it becomes available.
Endnotes
-
1
To be clear, there are currently large racial disparities within Georgia’s five largest counties, so a further area of inquiry is whether any backlog is being evenly distributed. -
2
Again, applications that are submitted, but not yet processed and accepted, will not be reflected in the analysis. As such, when this analysis refers to a “requested” mail ballot, a more technical understanding would be a request that has been submitted, processed, and accepted. -
3
For this analysis, we use voter file data from L2 Political and absentee ballot data from the Georgia Secretary of State. L2 estimates voters’ racial/ethnic characteristics, as well as their party affiliation, based on commercial and public data. -
4
Georgia does not have a permanent vote-by-mail option, so each voter has to make a request for each election. These analyses do not meaningfully change when we examine the 2020 behavior of voters who did not vote by mail in the 2018 primary election.