
Tightening polls in the presidential race and a nail-biter of a battle for control of the U.S. Senate are getting much of the attention as we near November 8. By contrast, the contest for the 435 seats in the U.S. House of Representatives has been a sleeper for most Americans. In fact, though the election hasn’t yet happened, we already know a lot about its outcome.
1. If Democrats win back the U.S. House, it will be in large part because of seats drawn by courts and commissions.
Since the beginning of the 2016 election cycle, the consensus of seasoned election observers has been that only somewhere between 33 to 40 seats in the U.S. House are seriously in play – meaning that Democrats would have to sweep the board in order to come away with the 30 seats they need for a majority. In recent days, the odds of a Democratic takeover have arguably improved somewhat. But the battle for control of the House remains by all accounts Republicans to lose, even if Democrats nationally were to win the presidency by larger than normal margins.
One thing, though, is clear: If Democrats do take back or make serious inroads in the House, seats drawn by courts and redistricting commissions will be a major factor this year. In fact, of the 40 seats currently identified by Cook Political Report as tossup, lean D, or lean R (as opposed to being firmly in either camp), 65 percent were drawn by courts or commissions.
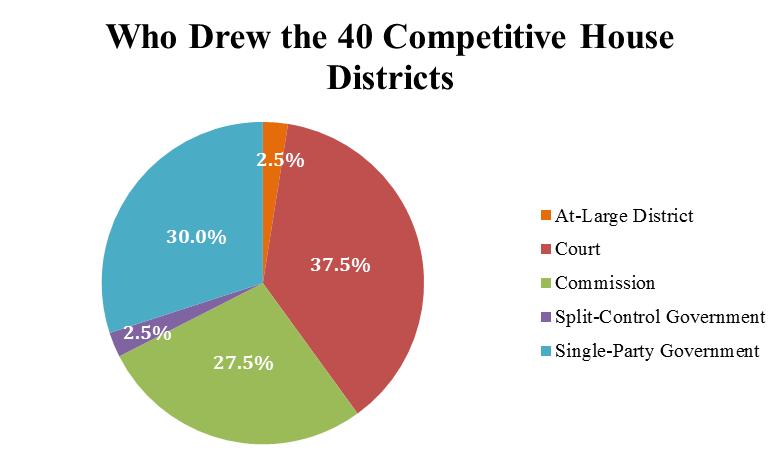
Figure 1: Competitive House Districts are defined as the 2016 House races rated as lean R, lean D, or tossup by Cook Political Report as of November 2, 2016.
These figures have been remarkably stable. Shortly after Labor Day, Cook Political Report rated 37 districts as competitive – of which 78 percent were drawn by courts or commissions. A week out from Election Day, that number has increased by just three.
And if you look just at the tossup races, the stats become even more striking. Out of the 19 tossup districts, just four (or 21 percent) were drawn by legislatures. And the remaining 15 seats, there are two districts in Florida that were redrawn this year after courts invalidated earlier maps drawn by state legislatures.
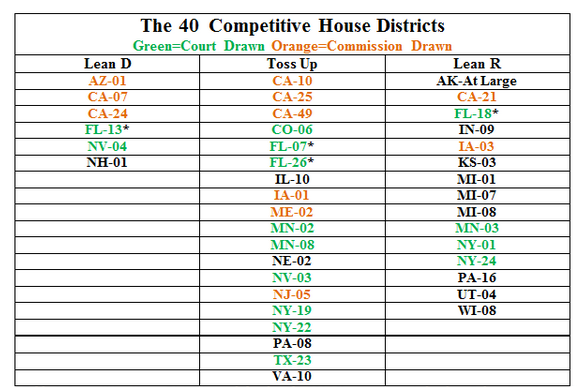
Table 1: Competitive House Districts are defined as the 2016 House races rated as lean R, lean D, or tossup by Cook Political Report as of November 2, 2016. The districts colored in light blue are from a court drawn or court approved legislative map. The districts colored in orange were created by a commission. Districts marked with an asterisk are a part of new court-drawn maps being used for the first time in 2016.
Of course, more things influence competition than just who draws a map. Geographic clustering (for example, the high concentration of Democrats in places like New York City) mean that districts in many parts of the country will never be competitive. And things like the advantage of incumbency and national political dynamics all can impact competitiveness in a given year. This year, for example, Republican gerrymandering overreach in some states like Pennsylvania mean that some seats might be vulnerable if there is a Democratic high tide. But what’s clear is that this year at least, Democratic and Republican hopes for control of the House hinge largely on a couple of dozen court and commission drawn seats.
2. More congressional seats are uncontested this year than are competitive.
If only a few districts feature hard-fought contests this year, for the voters who live in 53 districts (28 currently held by Republicans and 25 by Democrats), there isn’t any competition at all. That’s because only one major party candidate is running. In gigantic Texas, for example, 10 of 36 congressional districts don’t have a two-major party contest this year. Likewise 5 of 9 of Massachusetts’ congressional districts are already decided.
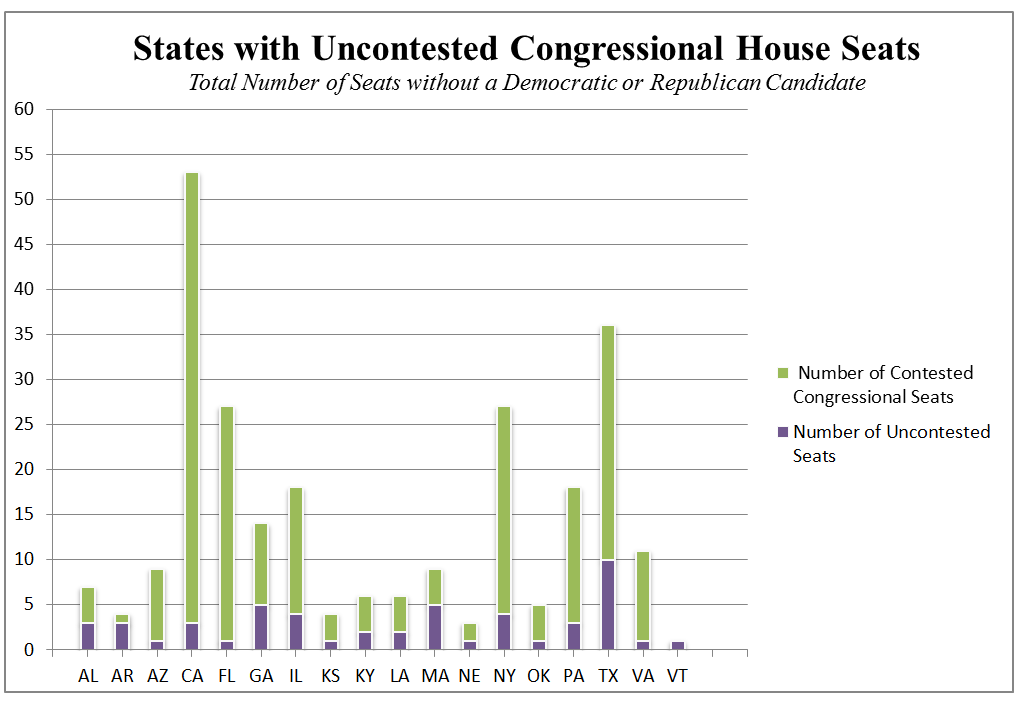
Figure 2: Percentages are calculated based upon uncontested congressional house seats in each state during the 2016 election as listed on Ballotpedia and each state’s secretary of state websites. Since California has a top-two primary system, the numbers reflect contested elections from the June 2016 primary. Only California districts without a Democratic and Republican candidate in the primary were counted as uncontested.
3. Most of America will see few, if any, advertisements about congressional races. That’s because almost all of the spending on congressional races will be in the competitive districts.
Given the lack of competitive races in most of the country, it’s not surprising that most Americans haven’t heard much about the candidates seeking to represent them in Congress – and won’t. In fact, the spending this cycle of the Democratic and Republican congressional campaign committees and their respective SuperPACs – the House Majority PAC for Democrats and Congressional Leadership Fund for Republicans – has been concentrated almost exclusively in the congressional districts.
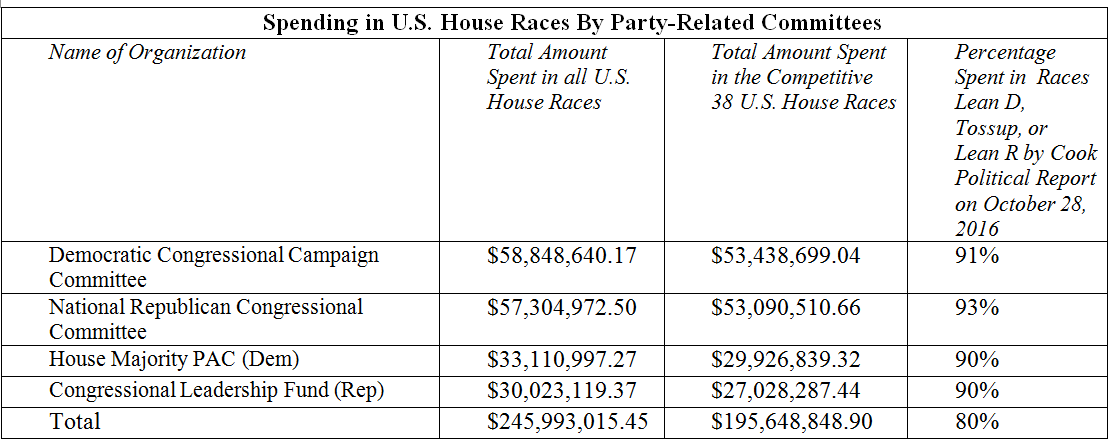
Table 2: Data reflects independent expenditures for all U.S. House races as reported the Federal Elections Commission by October 28, 2016.
What that means is that while the voters of the Twin Cities are being deluged with $12.6 million in ads aimed at the voters of three competitive districts, for most Americans, it’s been radio silence on the issues of the day.