
It sometimes gets argued that geographic clustering of Democrats in cities is responsible for the fact that Republicans have an advantage when it comes time to draw congressional and legislative maps. That argument certainly has been made in North Carolina, where the state has been mired in a decade long fight over allegations of racial and now partisan gerrymandering.
But the claim that clustering rather than politics is giving North Carolina a Republican tilt turns out to rest on some pretty dubious premises. That’s because the high rate of partisan bias seen in this decade’s North Carolina map is a new phenomenon. And it coincides not with any sudden and unexpected migration of Democrats into cities after 2010 but rather with a change in the party that had control of the redistricting process. Up until 2011, Republicans in North Carolina had never had sole control of the redistricting process. That changed in 2011, and the difference between North Carolina’s pre-2011 maps and the one drawn by the new Republican majority could not be more stark.
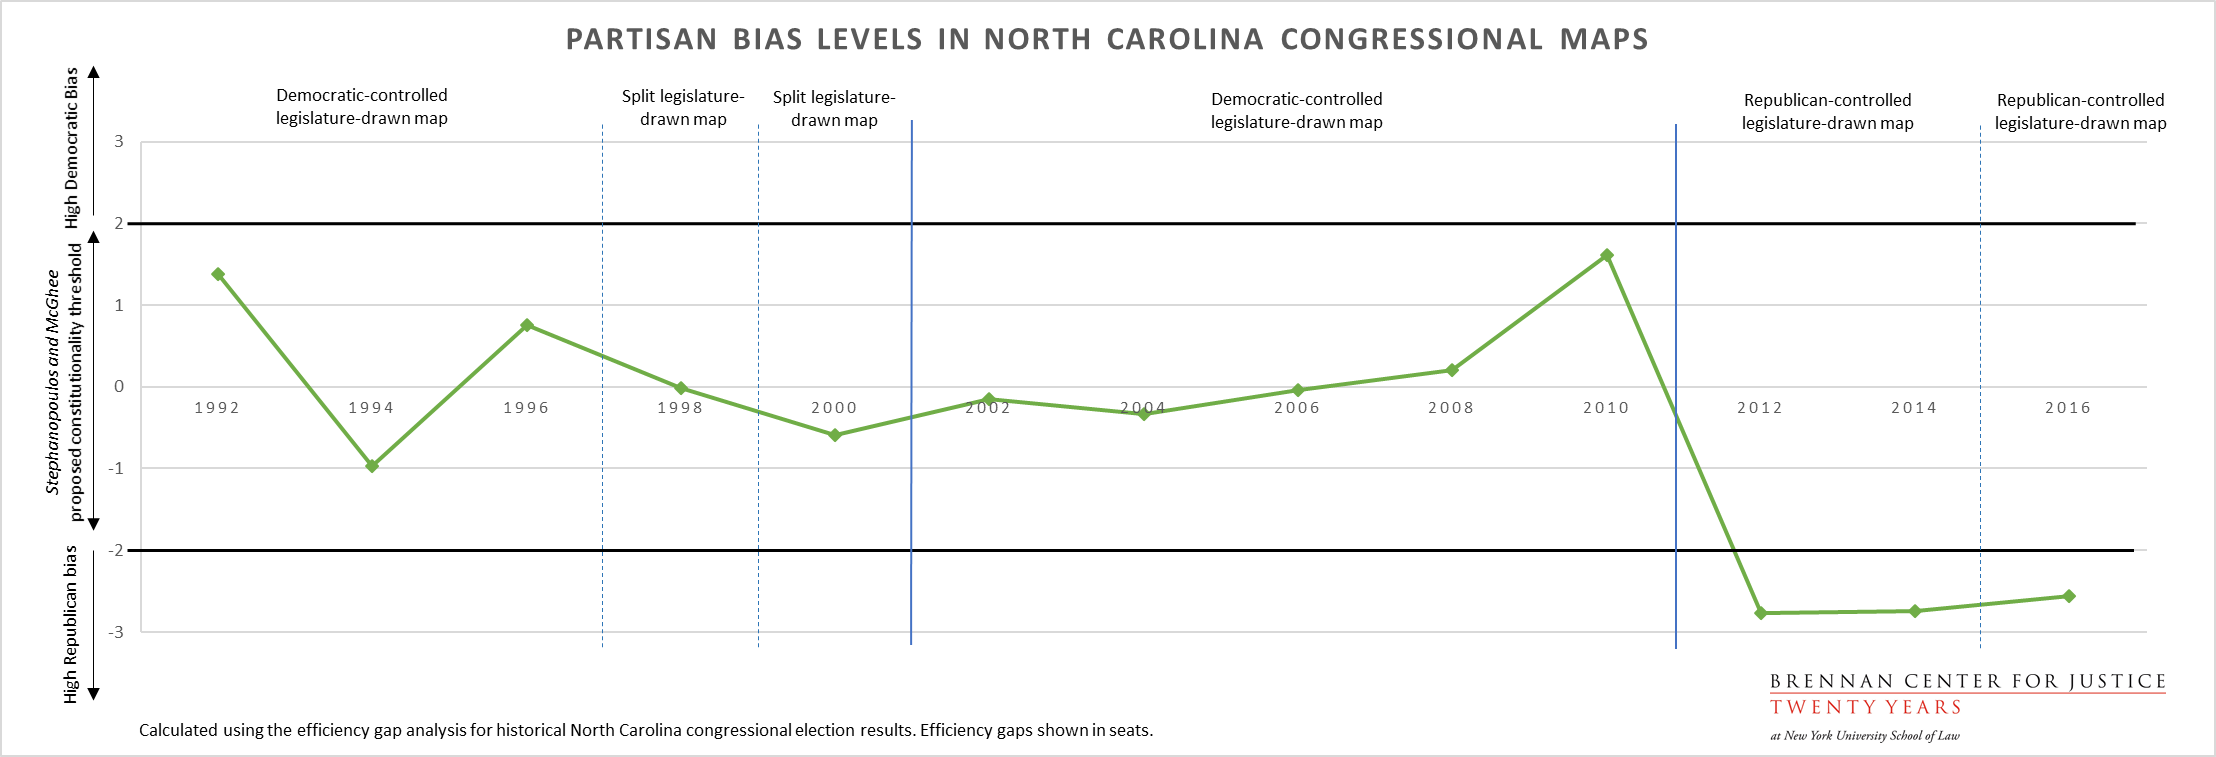
In short, if you are looking for why maps in North Carolina and six other single-party controlled states are biased, start with who drew the map.