
In January, Oregon became the first state in the country to implement automatic voter registration (AVR). The state changed voter registration at its Division of Motor Vehicles from an “opt in” to an “opt out” — a subtle change, but one with the potential to make a huge impact. According to recent data, that is exactly what is happening: AVR is nearly quadrupling the rate of new registrations at the DMV, and has already increased the registration rate by nearly 10 percentage points, accounting for population growth. Although an analysis of the full impact of automatic registration will have to wait until after the election, it is becoming more and more clear: Oregon is the Usain Bolt of voter registration.
This year, Oregon has been releasing monthly data from “Oregon Motor Voter” — the state’s AVR program. With several months of data now on hand, there is substantial evidence that Oregon is registering new voters at a massively increased pace, and that increase held steady throughout the course of the year.
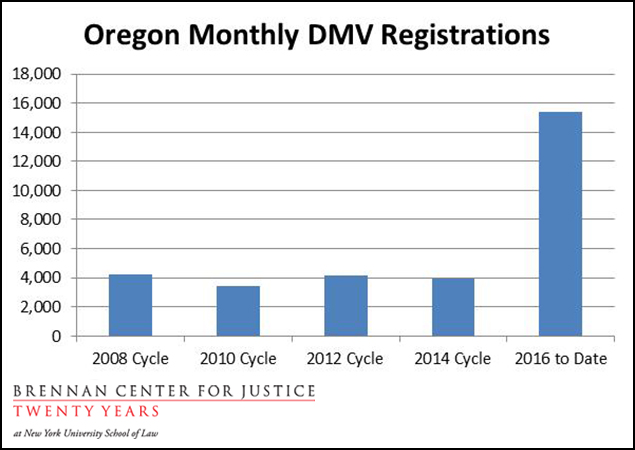
Oregon reported, based on transactions through July 31, the state has added 222,197 new voters through AVR. Of those, 95,605 were registered based on new interactions at the DMV that occurred between January 1 through July 31. The other 126,592 were added in a “lookback” at those who visited the DMV in 2014 and 2015 and did not register (more on that later). The 95,605 voters were added over the course of 130 business days, which means Oregon is adding per 15,433 per month, or 735 per business day. These figures are consistent with past findings.
The numbers also mean Oregon is continuing to significantly outpace its previous rate of new registrations at the DMVs. In the 2008 election cycle, Oregon reported to the Election Assistance Commission that it registered 101,159 voters at the DMV — a prorated total of 4,215 per month. In 2010, Oregon added 3,397 per month, and as we reported earlier, in 2012 and 2014, Oregon added 4,163 and 3,955 per month, respectively. Thus, Oregon is continuing to achieve an approximately 4-fold increase in new DMV registrations compared to past cycles.
But there are even further gains. Oregon’s voter rolls also got a major shot in the arm from “Phase II” of AVR, in which the state registered voters who visited the DMV in 2014 and 2015. Through that aspect of the program, Oregon has added another 126,592 voters to the rolls — for a total of 222,197 new registered voters—and that is only through the end of July.
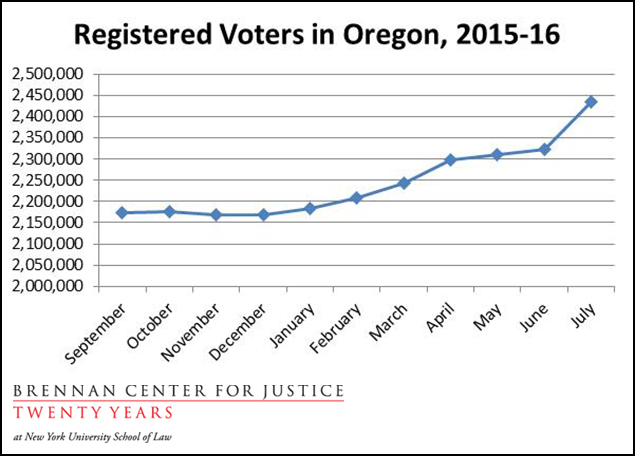
Looking at the monthly registration totals since AVR was implemented in 2016 suggest that it is making a big difference. Since the start of the year, the estimated registration rate (calculated by dividing the registration totals by the Census’s most recent estimate of Oregon’s citizen voting age population of 2,830,525) has increased from approximately 77 percent to approximately 86 percent — a 9 point increase. In prior months, the registration rate had stayed flat:
|
Month |
Registered Voters |
Estimated Registration Rate |
|
2,173,964 |
76.8% |
|
|
2,176,450 |
76.9% |
|
|
2,168,381 |
76.6% |
|
|
2,169,258 |
76.6% |
|
|
2,183,167 |
77.1% |
|
|
2,209,217 |
78.0% |
|
|
2,243,077 |
79.2% |
|
|
2,298,420 |
81.2% |
|
|
2,309,829 |
81.6% |
|
|
2,323,847 |
82.1% |
|
|
2,434,581 |
86.0% |
Moreover, the number of month-by-month registrants is increasing dramatically in 2016 compared to the number of registrants (and estimated registration rate, calculated by dividing the registration totals by the Census’s 2012 estimate of Oregon’s citizen voting age population, 2,806,000) the same period in the 2012 election cycle. This strongly suggests the increase in registrations is not attributable solely to the upcoming election — AVR is bringing in new voters who would not be registered otherwise.
|
Month |
Registered Voters |
Estimated Registration Rate |
|
2,034,589 |
72.5% |
|
|
2,051,857 |
73.1% |
|
|
2,062,051 |
73.5% |
|
|
2,049,834 |
73.1% |
|
|
2,056,197 |
73.3% |
|
|
2,070,470 |
73.8% |
*Because of redistricting, Oregon did not report total registered voters from October 2011 through February 2012.
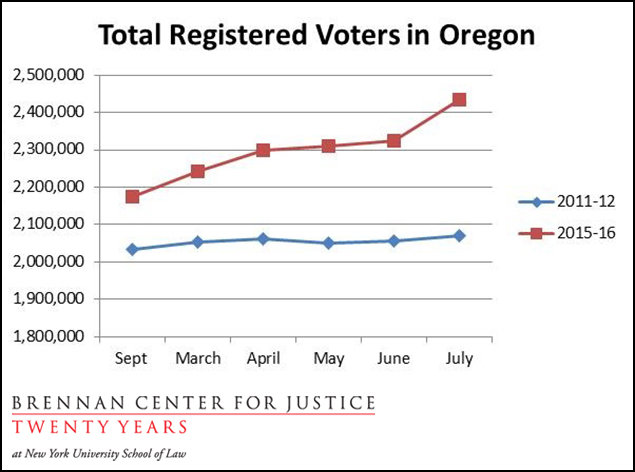
Compared to July 2012, Oregon has 364,111 more registered voters in July 2016, with most of these gains coming in the last few months. Although other factors, such as population growth, partially account for this increase, it is very likely automatic voter registration had a lot to do with it. The new registered voters represent a 17.6 percent increase from the 2012 figure. By comparison, according to census data, Oregon’s overall population increased by only 197,904 – 5.2 percent – between 2010 and 2015. Meanwhile, the citizen voting age population increased by approximately 24,000 between the Census’s 2012 estimate and its most recent estimate.
Only a few months into implementation, automatic voter registration is already making a big difference in Oregon. While other states are dragging their feet on voting rules, Oregon is racing ahead.
(Photo: Thinkstock)