
The views expressed are the author’s own and not necessarily those of the Brennan Center for Justice.
It all started innocently enough. I wanted to know how many delegates Hillary Clinton and Bernie Sanders had won. I was interested in the total for both the pledged delegates and the “superdelegates.” in other words I wanted to know the number of “pledged” delegates each candidate won in a caucus or in a primary and who are expected to vote for their candidate on the first ballot, as well as those mysterious “superdelegates,” party officials who can leap over a candidate in a single bound and vote however they wish in Philadelphia.
Little did I know you need degrees in political science, statistics, and psychology to fully understand the Democratic nomination process and the passionate argument that has broken out about it.
Even the experts are confused:
Different Sources, Different Counts*
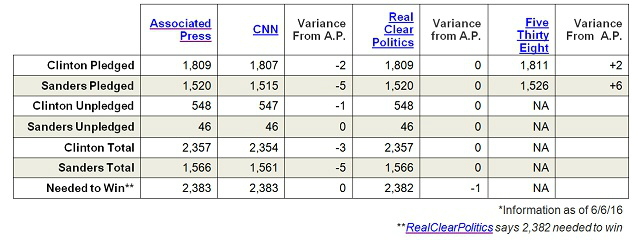
Turns out the “authoritative” sources such as the Associated Press, CNN, RealClearPolitics and FiveThirtyEight disagree about how many delegates the candidates have won in primaries or caucuses or their support among superdelegates. The numbers can change daily. In the two weeks I’ve been watching them, the tallies have changed regularly, even though there haven’t been any new primaries or caucuses. Nor has there been a stampede of superdelegates to one candidate or another. At one point, The Washington Post and FiveThirtyEight’s pledged delegate counts differed by 21. They have since scrubbed their numbers and brought them closer together. In addition, on a few sites, the numbers used in stories don’t jibe with the numbers they use in their detailed delegate charts.
The authoritative sources even disagree about how many delegates it takes to win the nomination. RealClearPolitics says 2,382, while A.P. and CNN say 2,383. FiveThirtyEight just ignores the superdelgates (whose support either Sanders or Clinton will need to win) and says nothing about how many votes are needed to clinch the nomination.
You might hope that the Democratic National Committee, nominally overseeing the whole nomination process, might provide some clear data. But no.
So I opened up Excel and started pulling some numbers.
Be warned: This is a fairly exhaustive look at votes and delegates that some may find exhausting. You can just skip to the subheadings of interest.
The Popular Vote
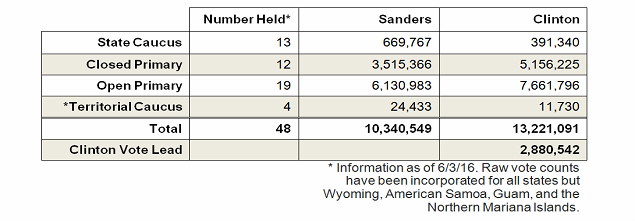
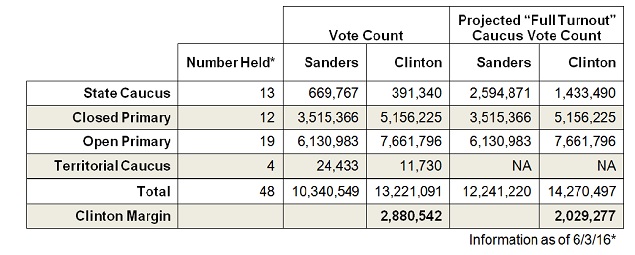
As of May 31, Hillary Clinton has 13,221,091 votes to Bernie Sanders’ 10,340,549. Those numbers include the raw vote counts from the caucus states with the exception of Wyoming and several territories which have not released raw vote counts. They do include Washington caucus numbers but not its primary vote counts. Washington’s delegate allocation process is druidic, with candidate preferences calculated to the third decimal point.
Popular Vote Count by Caucuses and Open and Closed Primaries
The Delegate Count
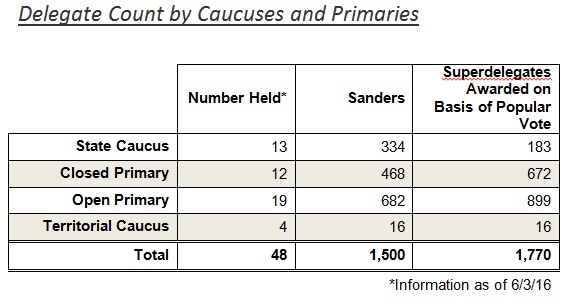
By my analysis, Clinton has 1,770 pledged delegates to Sanders’ 1,500. We’ll discuss superdelegates later. See methodology below to learn how I resolved the conflicting numbers.
Delegate Count by Caucuses and Primaries
Now it gets ugly. If you’ve been on Facebook or Twitter lately you know that these numbers are not regarded as legitimate by either side, especially Sanders partisans.
The principal Sanders arguments are:
- Sanders does better in open primaries because independents support him. If the closed primary states that Clinton won had been open to independents, Sanders would have the lead.
- Caucus states are undercounted or not counted in the popular vote. Even if we count the raw vote in caucuses (which was done in the Popular Vote table above), there is still an undercount because turnout is low in caucus states. If caucus turnout had matched turnout in open primary states, and if Sanders had won those votes (in proportion to his win of the closed vote), he would be ahead.
- Clinton will only win because of the support of superdelgates, which is fundamentally undemocratic.
And Clinton supporters have their grievances:
- Caucuses suppress voter participation and therefore delegates won through the caucus system are not representative of the will of the population-at-large.
- Clinton needs more voters per delegate than Sanders. He is actually “overperforming” in the delegate count given his proportional share of the vote.
- Why should Sanders complain about superdelegates when each candidate is pursuing their support regardless of how each surperdelegate’s state voted?
Let’s see if we can throw some facts at these contentions.
Open Primaries vs. Closed Primaries
The argument about open versus closed primaries took off after New York’s April primary.
“Three million people in the state of New York who are independents have lost their right to vote in the Democratic or Republican primary,” Sanders wailed at the time. “That’s wrong.” (Sanders was sort of right. There are about 500,000 registered independents in New York and about 2.5 million voters whose affiliation is blank.)
And boy, New York’s rigidly closed primary system looks horrid. Only registered Democrats or registered Republicans can vote in each party’s primary. And the deadline to change party affiliation is six months before the election. That deadline cost Donald Trump his own children’s votes.
But many have questioned whether Sanders truly has enjoyed an advantage in open primary states. The data validates the skepticism. Clinton has won 13 of the 19 open primaries. Moreover, her margin of victory in those open primary states has been higher than in closed primary states. (Sanders’ winning margins in open primaries have been slightly higher too.) FiveThirtyEight has come to a similar conclusion using a different methodology.
Turnout and Victory Margins in Caucuses and Open and Closed Primaries
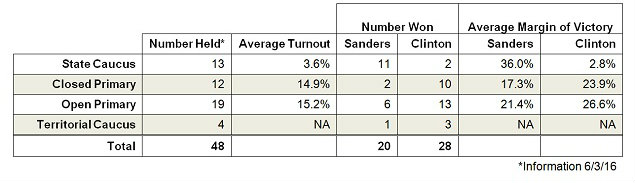
On balance, Clinton does well in either type of primary. But caucuses? It falls apart for her there.
Caucuses
Sanders has performed very well in caucuses. He has won big and often in caucus states. Clinton has squeaked by in two. Still, Sanders’ supporters complain that the 2.8 million popular vote lead enjoyed by Clinton is distorted because caucus votes are undervalued or in some cases not counted at all. For example, RealClearPolitics’ Popular Vote scoreboard does not include caucus raw votes. As noted, I included the caucus raw vote in my popular vote tally.
But some Sanders supporters take the argument further. They point out that caucuses have low turnout. They argue that if caucus turnout matched that of primary states (open or closed), Sanders would garner more votes and Clinton’s lead would diminish. They’re right, but it’s not enough to make difference. While it’s true Sanders’ vote total surges nearly 20 percent, from 10.1 million to 12 million, Clinton’s vote totals also increase, from 13.2 million to 14.3 million. In the end, Clinton is still ahead by more than 2 million votes.
Projected Vote Totals If Caucus States Had Open Primaries
Sanders supporters’ argument is cockeyed. (I’ve indulged it anyway). It’s simply unrealistic to assume that caucus state results would be the same had a caucus state used a primary system instead. Just take a look at the wrangling over Washington state’s delegates last month, which has now held both a primary and a caucus, if you want a test of the proposition.
In any event, caucus voter turnout is staggeringly low. Average turnout in a caucus state is 3.6% of eligible voters compared to 15% in primary states. Caucuses are the least democratic method to gauge popular will. With their requirements that voters arrive at a specific time and then devote at least an hour to the process, caucuses exclude those with inflexible job schedules, family responsibilities or even those who simply don’t have the time.
There’s no indication from polling data that Sanders would do any better in a primary than in a caucus. Despite Sanders’ popularity among millennials, overall, his voters are less energized than Clinton’s. According to a March Gallup survey, 54% of Clinton supporters were enthusiastic about their choice, compared with 44% for Sanders. Washington’s experiment in both primary and caucus voting demonstrates that Sanders might have even lost caucus states if they had used primaries instead. In fact, Clinton’s standing with Democrats and “Democratic-Leaning Independents” remains relatively high at 66%, according to late May Gallup data, with Sanders at 70%.
Voters Needed Per Delegate
Clinton supporters complain that she has had to get more votes per delegate than Sanders. They contend that because of various delegate selection rules, especially in caucuses, Sanders is garnering more delegates that he would be entitled to simply based on his share of the vote. In other words, Sanders is “overperforming” his vote totals. In effect, Clinton supporters are raising the specter of “One Person, One Vote.” They’re right. But not for the reasons they think.
Votes Received Per Delegate Awarded
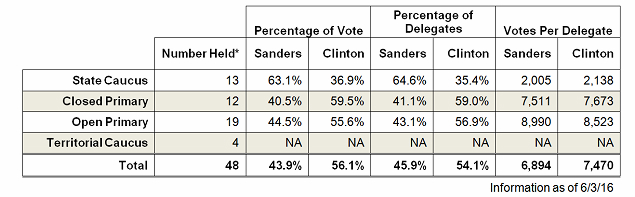
Yes, so far, Clinton has had to win more votes for each delegate. While she has 56.1% of the popular vote, she only has 54.1% of the delegates. On average, Clinton has 576 more individual votes per delegate than Sanders. But comparing caucuses-to-caucuses or primaries-to-primaries, the difference between the candidates in votes per delegate does not exceed 10%. If this were a “one person, one vote” case, that 10% differential would be regarded as de minimis.
This particular Clinton complaint does, however, highlight how disproportionately caucus voters are rewarded. If the caucus system were ever challenged in the Supreme Court on a “one person, one vote” basis (not actually a possibility), it would almost certainly be struck down.
Superdelegates
Never even mind determining how many “unpledged” or superdelegates each candidate has; there is no agreement on how many superdelegates are out there. According to a January document from the Democratic National Committee, there are 716 superdelegates. But two of the superdelegate slots are vacant, leaving a total of 714. That’s the number used by the A.P. But that does not mean that there are 714 superdelegate votes. The 8 superdelegates from Democrats Abroad each get ½ vote, or a total of four votes. That brings the superdelegate vote total to 712, which is the number used by RealClearPolitics.
But the real issue with superdelegates is not how you count them, it’s whether they should exist at all. Superdelegates are an affront to a strict democratic candidate selection process even if they don’t ultimately overturn the popular will.
What would the count look like if superdelegates were allocated on the basis of the popular vote? I awarded Clinton or Sanders superdelegates based on the proportional vote totals in the home state of each superdelegate. Then I did a separate calculation awarding superdelegates on a winner-take-all basis. Here’s the result:
Superdelegates Awarded on Basis of Popular Vote
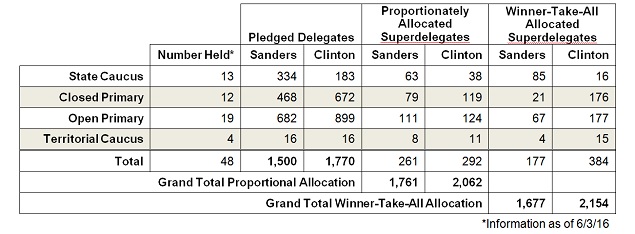
Under this system, Clinton would still come out ahead in the overall delegate count, but her lead would shrink notably. Currently, Clinton ostensibly has 500 more superdelegate votes than Sanders. On a proportional allocation basis, her superdelegate lead would shrink to 31. And her overall delegate lead (pledged and superdelegate combined) would narrow from 813 to 301.
Unfortunately for Sanders, no matter how many plausible – or implausible – assumptions you place into the math, it seems nearly impossible for him to win the Democratic nomination. And generally, parties don’t take a hard look at their nominating rules unless they lose a presidential election or two. The last time the Democrats seriously examined their nominating rules was in 1982, in a commission led by Jim Hunt, Jr., the former governor of North Carolina. And that body’s major innovation was the “superdelegates” who are so often criticized today.
Perhaps the Democrats would be wise to re-examine their nominating rules regardless whether the letters T-R-U-M-P ever hang from the lamp in the North Portico.
Methodology and Definitions:
How Did I Resolve Data Differences Between the Sources: I compared the sites to determine where they diverged. I then cross-checked and resolved those disparities against the source data offered at the website GreenPapers. I obtained raw caucus vote totals from The Washington Post.
Closed vs. Open Primary: I defined an open primary as any contest where unaffiliated voters could vote in a party primary without changing their affiliation status. Data from FairVote was used to assess each primary.
Turnout: Data is from the United States Elections Project. I calculated Democratic turnout for each state, not combined Democratic and Republican turnout. To project the “Full Turnout Caucus Vote,” I assumed turnout in caucus states would equal the average of turnout in Open Primary states (15.1%). I multiplied this with the Voting Eligible Population and then allocated those “votes” proportionately based on the caucus results in each state.
Superdelegates: Superdelegate calculations were based on their origin states. There are 716 superdelegates in total. Of them, 561 are from states that have had a caucus or primary to date.
Territorial Caucuses: Raw vote counts were not released for three out of four of them. Consequently, I did not do more detailed analysis (e.g. votes per delegate) for those contests.
Follow the author’s Tumblr page: Electoral Dysfunction