
*Research provided by Eric Petry
As part of a series of analyses of outside spending in the 2014 midterm elections, the Brennan Center examined outside expenditures reported to the FEC through Election Day in the most competitive U.S. Senate contests.[1] “Outside spending” refers to election-focused expenditures by anyone other than the candidates. These competitive races have attracted the greatest amount of outside spending. The analysis below details not only the record amounts of outside spending in 2014, but also the dominance of “dark money groups,” which are outside groups that don’t reveal all the sources of their funds. For the first time, the Senate changed hands because of the victories of several candidates who were overwhelmingly backed by these groups. Ten winning candidates together benefited from $127 million in dark money – more than 70 percent of the nonparty outside spending in their favor. The victors will take their seats likely feeling grateful to interests that are hidden from their constituents and the public.
We will release a detailed report comparing outside spending with candidate spending early in 2015.
$342 million in nonparty outside expenditures
In the 11 most competitive senate races, there has been $342 million in spending by groups other than the candidates and the political parties. The parties spent an additional $89 million in these contests. As a comparison, in the 2012 elections, nonparty outside spending in senate races reached $259 million for all 33 contests. As with all analyses of FEC data, these totals do not include spending on ads that are not required to be reported to the FEC because they don’t explicitly call for a vote and are not aired close to an election.
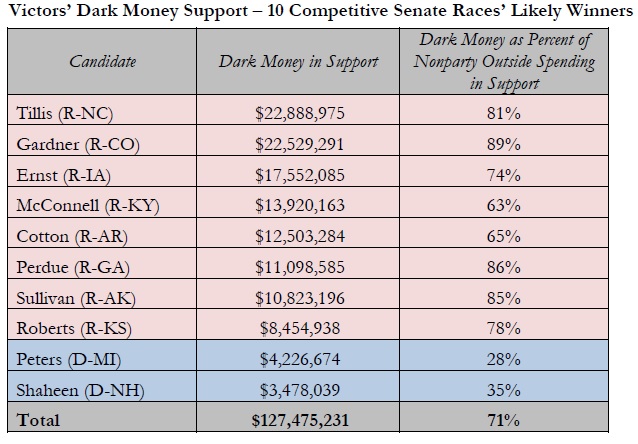
$127 million in dark money supported the winning candidates
“Dark money” is spending by groups that hide the identities of some or all of their donors. There was $203 million in dark money spent in these 11 races. The great majority – 71 percent – of the outside spending in support of the 10 winning candidates (counting likely winner Dan Sullivan in Alaska and excluding Louisiana, where a runoff will be held) came from dark-money groups.[1] Across these 10 contests, there was a total of $191 million in dark money and $127 million of that (or 67 percent) supported the winning candidate.
Outside spending is ruled by a few wealthy donors
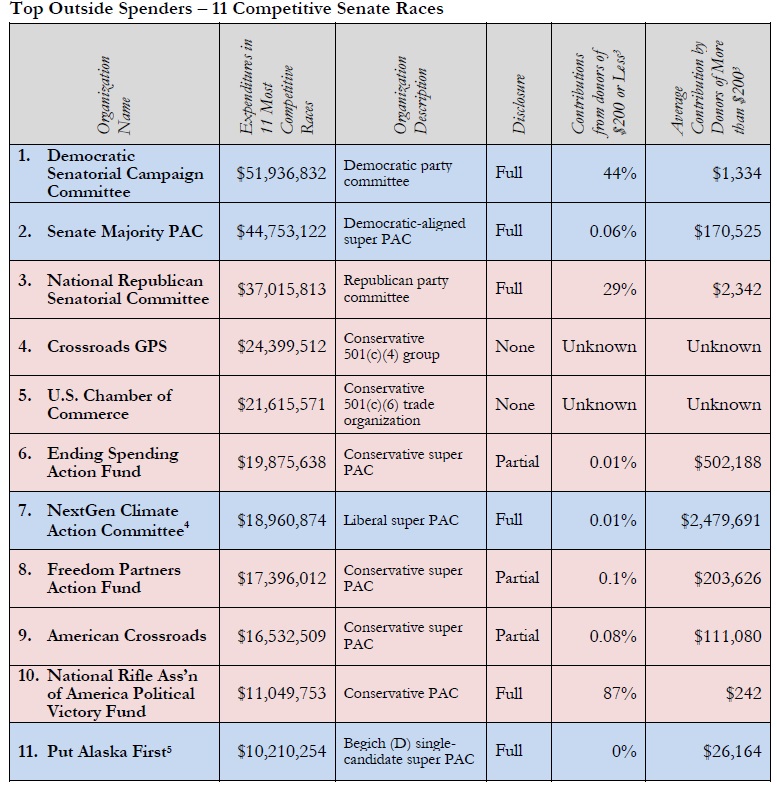
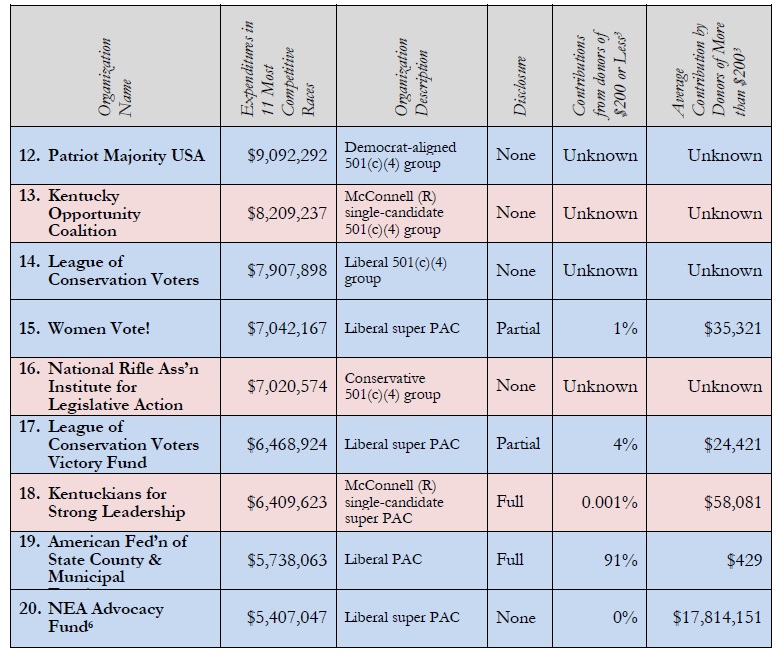
As shown in the table of top spenders below, nonparty outside spending is largely the domain of a small, wealthy class of donors. In contrast to the party committees, which receive large portions of their contributions from small donations of $200 or less, most of the big-spending super PACs (which, unlike dark-money groups, must report their donors) get virtually none of their money from such small donors. Four of the five highest spending super PACs all received less than one-tenth of one percent of their contributions from donors of $200 or less. The exception, Freedom Partners Action Fund, received slightly more than one-tenth of one percent from small donors.
The average contributions from donors of more than $200 for the top super PACs are significantly more than the average household income in the U.S., which is $73,000. For the top-spending super PAC, Senate Majority PAC, the average contribution of $170,525 is more than twice the national average household income. For the second highest-spending super PAC, Ending Spending, the average contribution is over half a million dollars, more than six times the average American household’s income. Of course, we have no way of know how much the dark money groups raise from small donors or how few donors provide their funds.
This Brennan Center analysis is part of #Money14, a series of independent reports exposing the role of money in American politics. Join us for an event near the fifth anniversary of Citizens United to hear more about the participating organizations’ innovative research and work together for a more inclusive, transparent, and participatory democracy.
[1] Both leading candidates in Louisiana saw significantly less than 71 percent dark money support, but total outside spending was low there, meaning the race is unlikely to bring overall winners’ figure down much.
[2] We examined FEC data, as collected by the Sunlight Foundation, concerning independent expenditures through Election Day. Our sample includes the eleven races that have been listed as “toss-ups” by the Cook Political Report in September or October: Alaska, Arkansas, Colorado, Georgia, Iowa, Kansas, Kentucky, Louisiana, Michigan, New Hampshire, and North Carolina.
[3] The figures in this table exclude revenue from political committees and other sources of revenue like loans. Only contributions from entities other than political committees, such as individual persons, corporations, partnerships, tribes, and unions, are counted. This is true of both the numerator and the denominator for percentage calculations as well as all values included in average calculations.
[4] Tom Steyer gave NextGen $56 million, or 94 percent of the group’s revenue.
[5] Put Alaska First gets the vast majority of its revenue from Senate Majority PAC; because Senate Majority is a political committee, its contributions are not included in these calculations.
[6] The NEA Advocacy Fund is fully funded by the National Education Association, so the super PAC’s “average” donation is equal to the NEA’s total contributions. It is not known how much NEA funding comes from small donors.