Redistricting is the process, every ten years, in which states redraw their congressional and legislative district maps. This process occurs nationwide, ostensibly to better reflect the most recent U.S. Census results. Historically, state legislatures were responsible for revising district maps, and many still are. Since the 1960s, however, an increasing number of district maps are drawn either by courts or by commissions, which can be appointed by or independent from the legislature. That these maps are redrawn (and the politicization of the redistricting process) garners much attention; less studied is the correlation between redistricting and voter turnout, how different redistricting institutions affect participation in elections, and how electoral competitiveness factors in to these relationships.
Competitive elections generally have higher rates of voter participation, and congressional districts drawn by commissions and courts tend to be more competitive than districts drawn by legislatures.1 Is voter turnout therefore higher in districts that are drawn by commissions?
This analysis compares individual-level turnout before and after the 2020 redistricting cycle to measure the effects of congressional redistricting — and the institutions that draw the districts — on electoral participation. It finds that court-drawn districts and those drawn by independent commissions, particularly the new independent commissions in Colorado and Michigan, tend to produce maps that result in higher turnout than those drawn by legislatures and appointed commissions. In addition to drawing unbiased districts that more accurately reflect the public’s view of the communities in the state, independent redistricting commissions, this analysis finds, also expand the electorate.
See Jamie L. Carson, Michael H. Crespin, and Ryan D. Williamson, “Reevaluating the Effects of Redistricting on Electoral Competition, 1972–2012,” State Politics and Policy Quarterly 14, no. 2 (June 2014): 165–77, https://doi.org/10.1177/1532440013520245.
Prior Literature
Competitive elections incentivize political parties and their candidates to invest in efforts to mobilize the vote.1 A 2016 meta-analysis of 185 studies into the factors motivating voter turnout found that competition was associated with higher turnout in 61 percent of tests within these studies.2
A competitive election can induce voters to participate even if conditions on Election Day offer reasons to stay home. For example, inclement weather is known to reduce Election Day turnout — except in counties where the election is close.3 Off-cycle elections tend to have lower overall turnout than those in presidential election years. Still, even in off-year House elections with no statewide race, competition and turnout are strongly and positively correlated.4
Historically, competition has influenced turnout more than election timing or registration rules.5 Yet competitive House districts are increasingly rare. The 2022 election cycle had fewer competitive races than any in the previous 52 years. In 2024, only 27 of 435 districts were considered toss-ups.
Social science research and the Brennan Center’s own work on competition in House races show that courts and commissions are more likely than legislatures to draw competitive districts.6 The relationship between redistricting and turnout, however, is less borne out. One 2018 study looked at redistricting prior to the 2012 elections in Florida, where the legislature had redrawn congressional maps, and found few effects.7A national study published in 2019 looked at the 2010 redistricting cycle and found no correlation between competition and turnout (though it did not consider the effects of different redistricting authorities).8
See V. O. Key Jr., Southern Politics in State and Nation (New York: Alfred A. Knopf, 1949); and Peter W. Wielhouwer and Brad Lockerbie, “Party Contacting and Political Participation, 1952–90,” American Journal of Political Science 38, no. 1 (February 1994): 211–29, https://doi.org/10.2307/2111342.
See João Cancela and Benny Geys, “Explaining Voter Turnout: A Meta-Analysis of National and Subnational Elections,” Electoral Studies 42 (June 2016): 264–75, https://doi.org/10.1016/j.electstud.2016.03.005.
See Thomas G. Hansford and Brad T. Gomez, “Estimating the Electoral Effects of Voter Turnout,” American Political Science Review 104, no. 2 (May 2010): 268–88, https://doi.org/10.1017/S0003055410000109.
See Bernard Grofman, Christian Collet, and Robert Griffin, “Analyzing the Turnout-Competition Link with Aggregate Cross-Sectional Data,” Public Choice 95, no. 3/4 (June 1998): 233–46, https://doi.org/10.1023/A:1004998403249.
See Erik J. Engstrom, “The Rise and Decline of Turnout in Congressional Elections: Electoral Institutions, Competition, and Strategic Mobilization,” American Journal of Political Science 56, no. 2 (April 2012): 373–86, https://doi.org/10.1111/j.1540–5907.2011.00556.x.
See Peter Miller and Bernard Grofman, “Redistricting Commissions in the Western United States,” UC Irvine Law Review 3, no. 3 (2013): 637–68, https://escholarship.org/uc/item/7ds4687w; and Carson et al., “Reevaluating the Effects of Redistricting on Electoral Competition.”
See Charles R. Hunt, “When Does Redistricting Matter? Changing Conditions and Their Effects on Voter Turnout,” Electoral Studies 54 (August 2018): 128–38, https://doi.org/10.1016/j.electstud.2018.05.007.
See Daniel J. Moskowitz and Benjamin Schneer, “Reevaluating Competition and Turnout in U.S. House Elections,” Quarterly Journal of Political Science 14 (April 2019): 191–223, http://dx.doi.org/10.1561/100.00018029.
Data and Methodology
The analysis below examines the 2020 redistricting cycle’s effects on electoral competitiveness and voter turnout and whether House districts drawn by courts, commissions, or legislatures had disparate effects on participation.
To distinguish a competitive race from a noncompetitive one, researchers typically look at the victory margin after an election, as does this analysis. That approach, however, assumes that postelection results are predictive of preelection strategy, which may not always accurately capture candidates’ preelection standing. Looking at postelection results is substantively different from, say, assessing whether voters perceive a race to be close before the election, or referring to preelection polls that suggest a tight race.
This study is limited to 21 states, each with 7 or more congressional districts. It looks for a change in district competitiveness between 2018 and 2022, so it omits the 3 states with 7 or more districts in which no district changed from noncompetitive in 2018 to competitive in 2022 (namely, Alabama, Massachusetts, and South Carolina). It uses the first voter file available after the 2022 elections to measure whether individual voters cast a ballot in both 2018 and 2022. (It does not factor in voters who cast a ballot in 2018 but were removed from the voter rolls before 2022 or who only voted in 2022.)
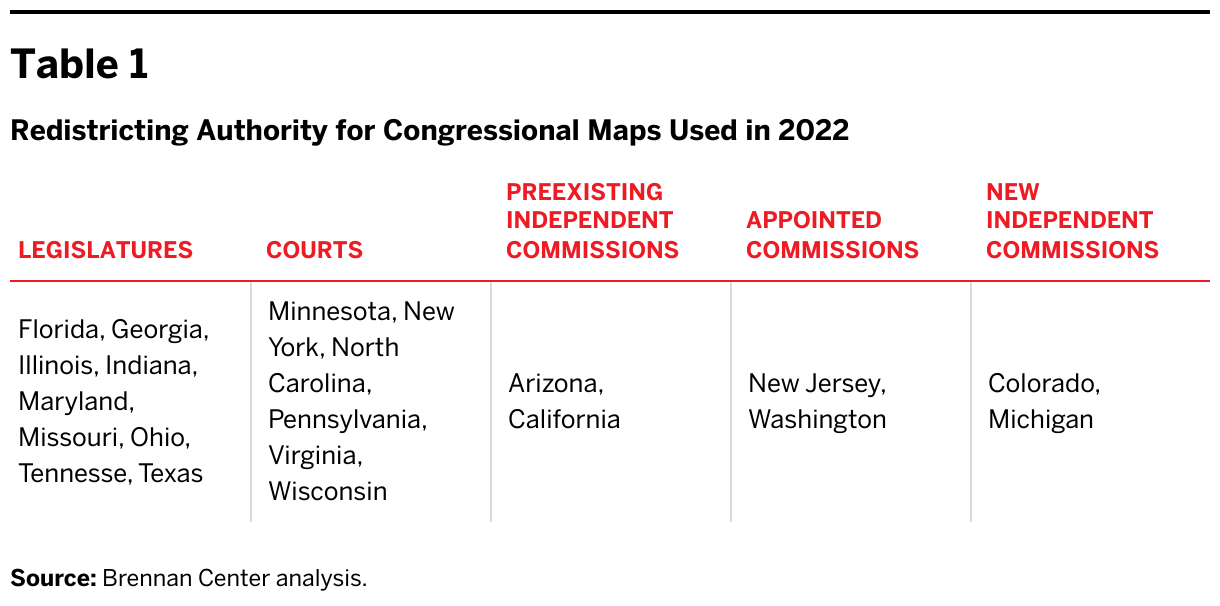
The study categorizes each congressional district in the 2018 and 2022 elections as competitive (i.e., the margin of victory was 10 points or less), noncompetitive (i.e., the margin of victory was more than 10 points), or uncontested.1 It also classifies each district by the institution that drew the maps, whether a legislature, a court, or a commission. The latter category is divided into preexisting independent commissions (in Arizona and California), new independent commissions (in Colorado and Michigan), and appointed commissions (in New Jersey and Washington).2
State legislatures typically draw congressional district maps. Of the 21 states examined for this study, 8 had legislature-drawn congressional districts. (Although an appointed commission drew Ohio’s congressional map, the commission consists of a four-member partisan sample of the legislature and three partisan statewide elected officials; Ohio is therefore grouped with the states that have legislature-drawn maps, bringing the total to 9 legislature-drawn states.) If a legislature fails to pass a map — or if courts invalidate the map it passes — then a court can opt to draw the districts, as happened in 6 of the 21 states considered.
The analysis includes all 4 of the states with independent redistricting commissions, along with 2 of the 5 states in which appointed commissions drew congressional districts. It distinguishes between the preexisting Arizona and California independent commissions and the newly formed Colorado and Michigan commissions for two reasons: First, the 2018 districts had been drawn by a court in Colorado and by the legislature in Michigan. Second, the maps drawn by these new commissions offer a glimpse into the effects of a new redistricting institution on voter turnout and competitiveness. More broadly, this framework offers clues into how a change in competition affects voter turnout, and into how redistricting institutions influence turnout when competitiveness does not change.
The first step in conducting this analysis was to locate each voter in the registration roll using the latitude and longitude coordinates of their residence within a congressional district according to the 2018 and 2022 district maps. The next step was to identify portions of the entire electorate that were moved from one district to another and classify those groups of voters by the competitiveness of the pre- and post-redistricting districts.3 To aggregate those results across all slices of districts and states within the same competition category, or within the same competition category and drawing body, averages across all turnout differences were weighted by the number of voters within that slice in order to estimate the turnout rate in 2022 and the change in turnout from 2018 to 2022.
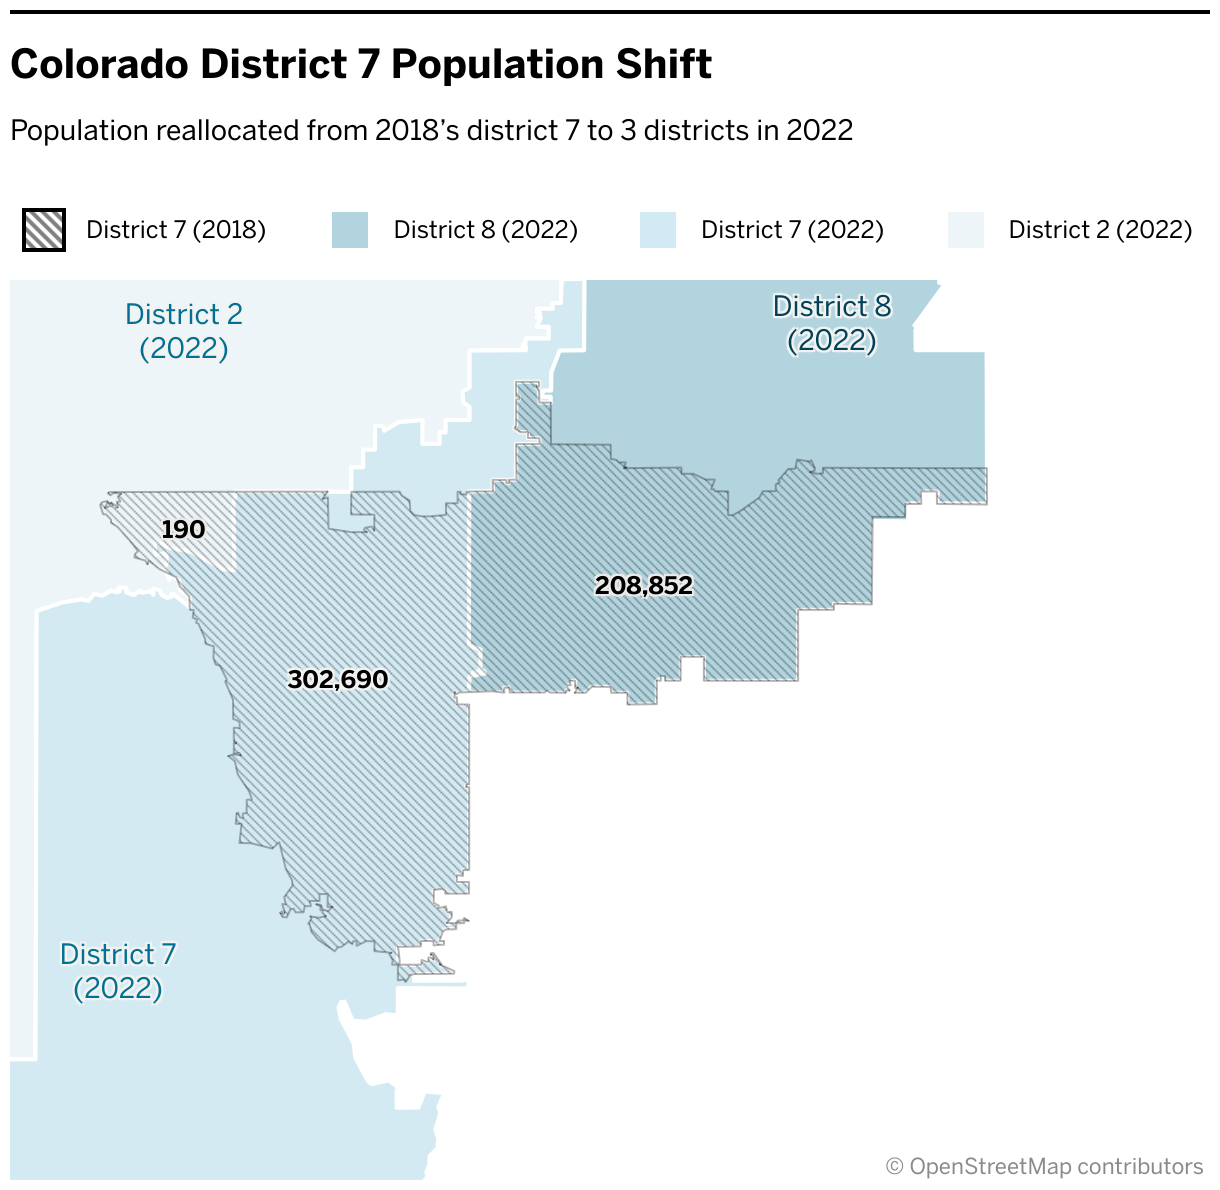
For instance, voters in Colorado’s noncompetitive district 7 in 2018 were dispersed among districts 2, 7, and 8 in 2022, as shown in the figure above. Districts 2 and 7 were noncompetitive in 2022, so the groups of voters in those districts were categorized as remaining in an uncompetitive district. The group of more than 200,000 voters who were relocated to district 8 were categorized as moving into a competitive district.4 This process was replicated for all voters in the analysis.
The data indicates that across all 21 states, between 21 and 200 groups of voters that formed population blocks were likewise shifted among congressional districts between 2018 and 2022. On average, the number of voters in these blocks ranged between 88,000 and 199,000.
The Arizona commission was adopted in 2000; the California commission was created in 2008 and its remit expanded to include congressional redistricting in 2010. Both commissions came about through statewide ballot measures.
Of note, the number of voters in these districts does not add up to the total population of the congressional districts because this analysis looked only at registered voters and not at total population.
Results
The results below first report average turnout in 2022 based on redistricting institution, then describe the change in turnout after districts were redrawn.
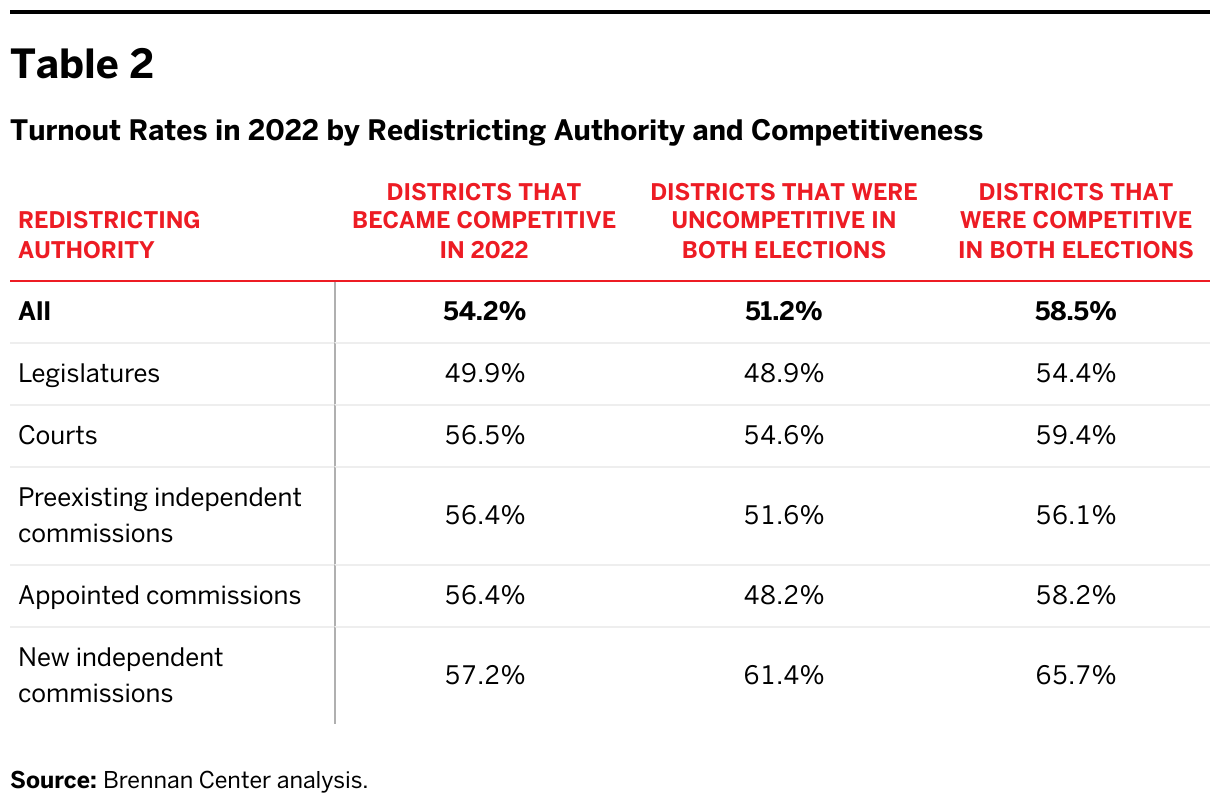
The first column of table 2 shows the turnout rate in districts that became competitive in 2022, which provides a good indication of baseline turnout in a newly competitive House race. Overall turnout was about 54 percent of registered voters. In districts drawn by legislatures, however, typical turnout was less than 50 percent, whereas turnout in court-drawn and commission-drawn districts was between 56 and 57 percent.
One measure of the turnout effects of commissions and courts can be ascertained by holding competitiveness constant and varying the institution drawing the districts. Those results appear in the next two columns of table 2. In districts that were uncompetitive in both elections, overall turnout was about 51 percent. (In other words, the effect of being drawn into a competitive district was about 3 percentage points.) Here, results for individual institutions vary more than they do for newly competitive districts.
The districts drawn by the appointed commissions in New Jersey and Washington had the lowest typical turnout rate, about a point lower than turnout in legislature-drawn maps. The districts drawn by the preexisting independent commissions in Arizona and California had turnout near the overall level. Court-drawn districts exceeded the overall effect by more than 3 percentage points; turnout in uncompetitive court-drawn districts was close to the overall turnout level in the newly competitive districts. Remarkably, in the uncompetitive districts drawn by the new independent commissions in Colorado and Michigan, turnout was more than 10 percentage points higher than the overall level.
Turnout levels among the districts that were competitive in both 2018 and 2022 follow the same pattern in that legislature-drawn districts had lower typical turnout than those drawn by the other redistricting institutions. Here, the consistently competitive districts drawn by the preexisting independent commissions had lower turnout than those drawn by courts or appointed commissions. The districts drawn by the new independent commissions had the highest typical turnout rate when competition was constant — more than 7 percentage points higher than the overall level and more than 11 points higher than districts drawn by legislatures.
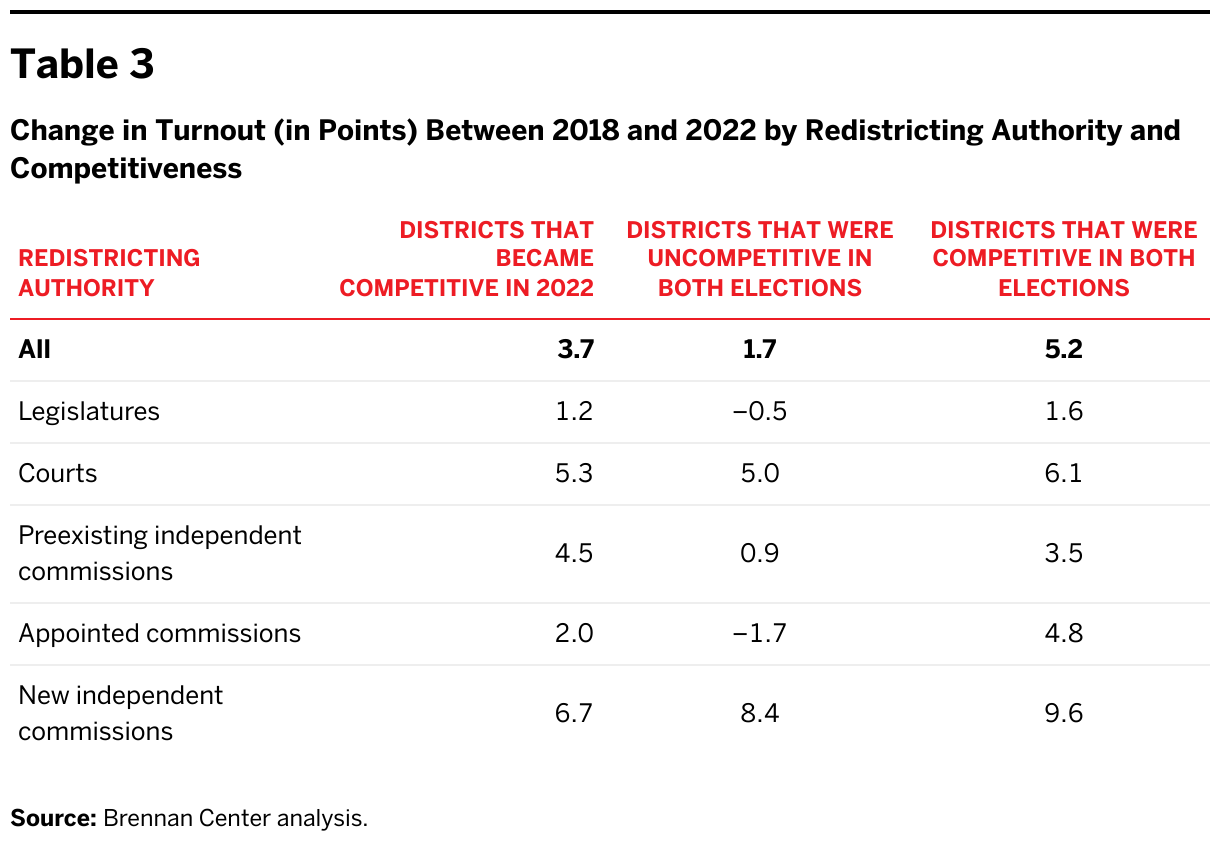
Table 3 reports the change in turnout between 2018 and 2022 for each redistricting institution as competitiveness varied. Turnout was about 4 percentage points higher in districts that became more competitive in 2022 compared to uncompetitive districts in both 2018 and 2022. Like the results in table 2, though, this effect was smallest among districts drawn by legislatures, where it was about one-third the magnitude of the overall effect, and largest among the new independent commission districts, where it was almost twice as large as the overall effect. Districts drawn by courts and preexisting independent commissions both exceeded the overall turnout effect.
When a district was uncompetitive in both elections, the change in turnout between 2018 and 2022 was about 2 percentage points (compared with 3.7 points for districts that became competitive). Turnout in consistently uncompetitive districts drawn by an appointed commission or a legislature was lower in 2022 than it was in 2018. In the districts drawn by preexisting independent commissions, turnout increased by about a point; in court-drawn districts, turnout increased by 5 percentage points. Once again, districts drawn by the new independent commissions saw the greatest effect: Turnout increased by about 8.5 percentage points.
Across all three measures of competitiveness, turnout increased less than the overall average in districts drawn by appointed commissions; in some cases, turnout actually decreased in appointed commission–drawn districts. This finding may be due to partisanship within the appointment process, which would lead appointed commissions to behave more like legislatures than independent commissions in deciding how to design maps. These results align with the fact that turnout outcomes resulting from maps drawn by appointed commissions tend to reflect those of legislature-drawn maps. Future work looking into the inner workings of appointed commissions and legislatures and how they relate to turnout may reveal interesting patterns.
Turnout increased by about 5 percentage points across all districts that were competitive in both elections. As this analysis has repeatedly demonstrated, legislature-drawn districts had the smallest turnout effects (less than one-third of the overall effect) and change in turnout was largest (about twice as large as the overall effect) in the districts drawn by the new independent redistricting commissions. The change in turnout among consistently competitive districts was larger in court- and appointed commission–drawn maps than in those drawn by the preexisting independent commissions.
Conclusions
When voters were moved from noncompetitive districts in 2018 to competitive districts in 2022, or when they were in competitive districts in both elections, voter turnout increased. This finding, which is consistent with long-established electoral research, underscores the importance of competition for increased participation among the electorate. Ensuring that voters are in competitive districts can encourage voter participation.
When turnout effects are analyzed by redistricting institution, the results show that even when looking at districts where competition did not change, turnout was highest and grew the fastest in the two states with new independent commissions. In contrast, turnout was lower (and grew the slowest) in states with legislature-drawn maps. Districts drawn by appointed commissions saw little change in turnout except when voters were drawn into competitive districts in 2022. Districts drawn by courts saw increased turnout at high rates relative to those drawn by other redistricting institutions.
One possible explanation for the higher turnout effects among maps drawn by independent commissions is the gap between legislators and the act of redistricting. As Bruce Cain observes, “commissions generally vary in their separation from elected officials and their ability to enact district boundaries autonomously. The independent citizen commissions are the culmination of a reform effort to limit the conflict of interest implicit in legislative control over redistricting.”1
While the results of this analysis do not definitively prove this connection, they are consistent with the idea that separating the act of redistricting from state legislatures produces positive dividends, including higher participation in elections. The similarities noted above between maps drawn by legislatures and appointed commissions are also consistent with the gap that Cain describes.
Michigan exemplifies the importance of independent commissions for the vitality of democratic institutions and the mobilizing effects of responsive redistricting institutions. In the five years prior to its redistricting commission’s establishment, the state legislature did not adopt any measures to make voting more accessible for Michiganders. In 2018, a citizen-led effort to overturn decades of partisan gerrymandering successfully launched the current independent commission. The legislature elected under the first fair districts in 2022 then continued the cycle of pro-voter reforms, adopting almost a quarter of the expansive voting rights laws in the nation in 2023.
The new commission-drawn maps in Michigan are also more responsive to changes in the will of the people than the partisan gerrymandered maps of the past were. In the 2024 elections, Republicans carried the state at the presidential level and won a majority of the state house. In short, the maps drawn by the new commission level the playing field for both parties and allow for shifts in power, in contrast to the entrenched majorities present in many partisan gerrymandered maps around the country.
The results of this analysis provide strong rationale for adopting independent redistricting commissions. In addition to neutralizing partisan gerrymandering, maps drawn by commissions tend to increase participation in elections. And robust voter participation, along with competitive elections and fairly drawn maps, are cornerstones of equal representation — the foundation of American democracy.