Skip Navigation
Expert Brief

Split Counties in Legislative Redistricting

Guidelines to preserve counties work best when they’re mandated by law.

The redrawing of legislative districts is a process that balances multiple interests and geographic considerations. How map drawers treat counties, the major geographic divisions of states, depends not just on a state’s population but on how state law prioritizes counties in the process.footnote1_dyrjHiQOMD2I3f04iVM-ri283r8ojR690LVVhdm5rPw_iIdXufnub0lJ1 We use the term county throughout this article for the sake of consistency. At the same time, we recognize that the subdivisions in Louisiana are referred to as parishes and in Alaska are called boroughs. We also recognize that counties within Connecticut, Rhode Island, and parts of Massachusetts are geographic units that have no separate legal authority. For the purposes of this report, we treat counties primarily as geographic units put through the redistricting process.  In this study, we assess the extent to which a state’s legislative districts respect county lines on the basis of state law requirements to do so.

Our inquiry is designed to measure the efficacy of statutory and constitutional directives related to county preservation in the redistricting process. We refrain from imposing any normative judgment on the practice of splitting or preserving counties. We expect that states with legal directives to keep counties together will do so, that states with no such requirements will tend to split counties more often, and that states in which county preservation is discretionary (typically instructing map drawers to preserve counties where “feasible,” “possible,” or similar) will fall somewhere between these two categories.

Prior to the 1964 U.S. Supreme Court cases Reynolds v. Sims and WMCA, Inc. v. Lomenzo, legislative districts typically contained whole counties, regardless of population differences.footnote2_78sZLN235SwVe6cN76dxkrSsdLPiOzs-bhselB4TdM_rHZXZFt6V3Pm2 Both decisions were announced on June 15; the Court also rejected legislative plans in Colorado, Delaware, Maryland, and Virginia on the same day.  In Utah, for an illustrative example, a joint resolution in the early 1950s would have allocated 31.6 percent of the state house seats to Salt Lake County (home to 39.9 percent of the state population at the time) and only one seat (or 3.4 percent) in the 29-member state senate.footnote3_U0mYyqBBwKekRNGaSj6eULDT5X-ewlJkdjL4LIh9N8_z4Mbckv2uJjB3 Frank Jonas and Brad Hainsworth, “Utah,” in Impact of Reapportionment on the Thirteen Western States, ed. Eleanore Bushnell (University of Utah Press, 1970), 268.  In addition, malapportionment across districts — which were infrequently redrawn — would increase over time following population shifts toward urban centers.footnote4_CMevoqvRZrVWFc0luzGS4B1bT8ms0MzenszvLedY_s12VdspS0xF34 See, e.g., Nathaniel Persily, Thad Kousser, and Patrick Egan, “The Complicated Impact of One Person, One Vote on Political Competition and Representation,” North Carolina Law Review 80, no. 4 (2002): 1343.

Reynolds held that state legislative districts must be drawn with roughly equal populations. At question was the redistricting process in Alabama, which apportioned one seat in the state house to each county and then distributed the remaining seats in the chamber among the counties on the basis of population; the state senate seats each represented a single county. Similarly, WMCA found that New York State’s apportionment process was unconstitutional because it did not use an equitable population basis.

Through these and other decisions premised on regular redrawing in order to maintain equal population across districts, the Court dispensed with biased redistricting processes across the country.footnote5_EWZqGWTBRFPsIe4q1OWk9tmwdad11wWW0TwVuK97yM_bZDGXV8bJbKQ5 See, e.g., Charles S. Bullock III, Redistricting: The Most Political Activity in America (Rowman & Littlefield, 2010), 30–31, table 2.1 (showing wide differences in district populations in each of the state legislative chambers).  What followed was a “redistricting revolution.”footnote6_JA6JkppYIkNYTrFLU4A4YPTkl4GrhaZbQtPSVoHYgng_dWKmH0si5cZJ6 See, e.g., Gary W. Cox and Jonathan N. Katz, Elbridge Gerry’s Salamander: The Electoral Consequences of the Reapportionment Revolution (Cambridge University Press, 2002), 3 (describing the Court’s intervention in the redistricting process as “arguably the most important change in the practice of American gerrymandering since its invention”). The Supreme Court most recently considered the question of population equality in legislative redistricting in Harris v. Arizona Independent Redistricting Commission, 578 U.S. 253 (2016), finding that deviations of less than 5 percent from the ideal population are permitted if the deviation is caused by legitimate considerations. One effect of this new population-equality standard was an increase in the frequency of districts that contained parts of multiple counties.footnote7_glJrCtgEJFF9kEJtq4HPnRY0IEeY6gBj0wwJFZa9RLI_d3IOfKBtLfoV7 See, e.g., Bullock, Redistricting, 40.  How this requirement operates across states with different standards of county preservation has been, until now, unknown.

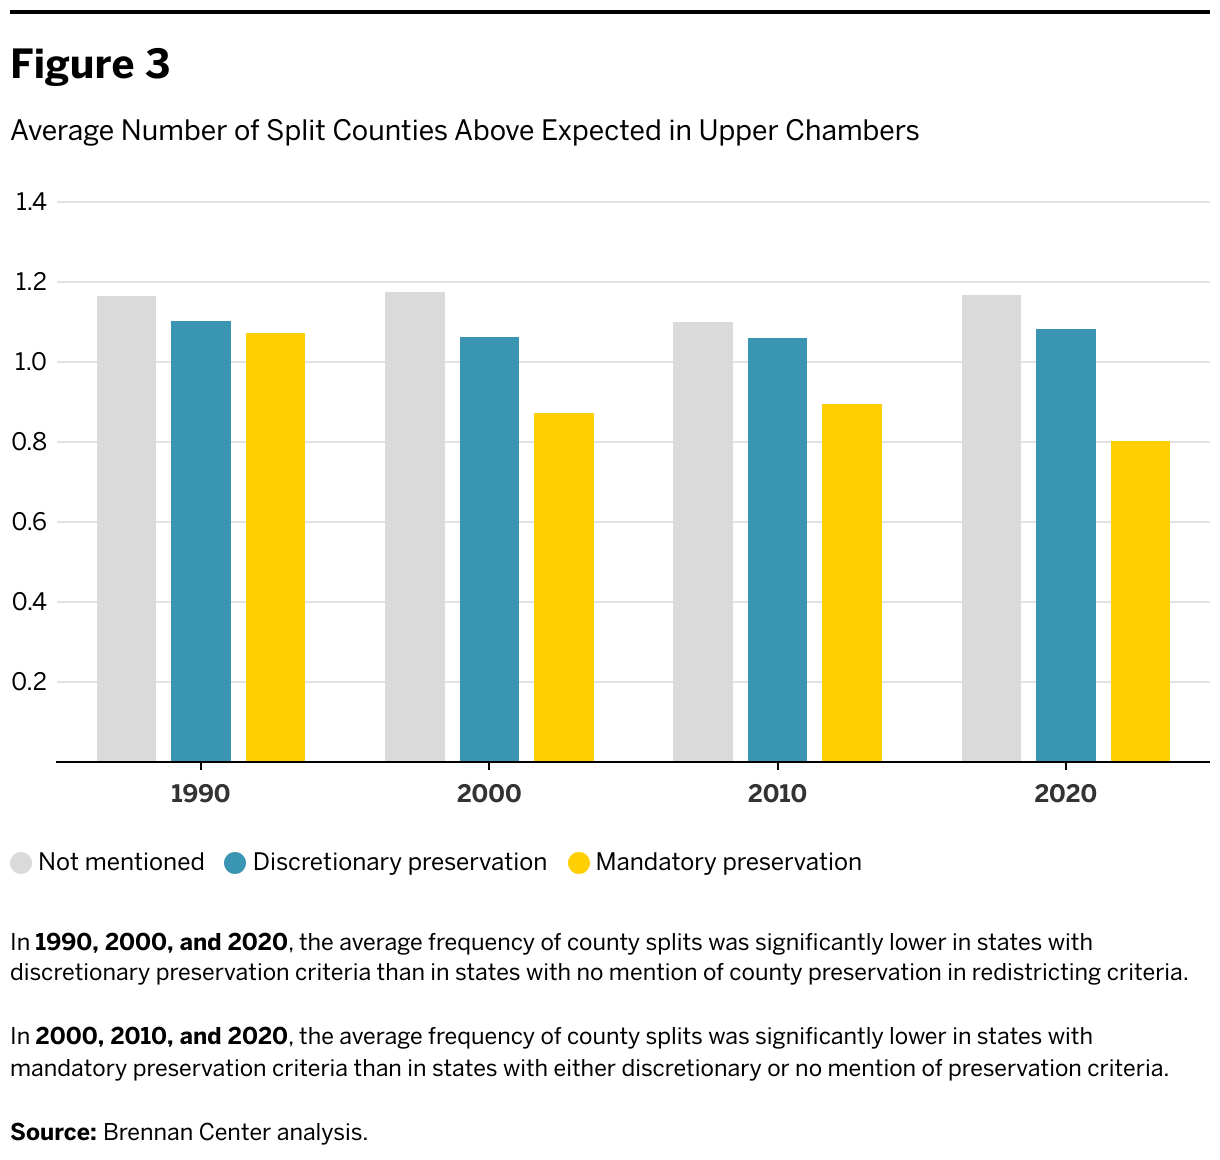
Here we examine the relationship between the legal requirements related to county preservation and the frequency of counties that are divided across districts.footnote8_-zrF1RxdaJQTKXbfSTwpMA7p9SHCBKu9DxAi5gp-EI_qgBCuOHN1Tci8 A related 2009 study found fewer uncontested legislative elections in states with standards protecting political subdivisions within a state. See Richard Forgette, Andrew Garner, and John Winkle, “Do Redistricting Principles and Practices Affect U.S. State Legislative Electoral Competition?,” State Politics and Policy Quarterly 9, no. 2 (Summer 2009): 151–75, https://www.jstor.org/stable/40421634.  Whether states have no requirements, discretionary preservation, or mandatory preservation results in different patterns in state house and senate districts. Mandatory county preservation has kept counties whole at a significantly higher rate than have the other categories in lower chamber districts since 1990, and in upper chamber districts since 2000. At the same time, in upper chamber districts, states with discretionary criteria had fewer county splits, on average, than states with no mention of county preservation in the 1990, 2000, and 2020 redistricting cycles. Contrary to our expectations, however, in lower chamber districts, states with discretionary criteria differed only slightly, if at all, from states with no county preservation requirements.

End Notes

County Preservation Regulations

Counties are not a standard geographic unit across — and even within — states, contributing to disproportionate representation in county-based redistricting. In the early 20th century, county-based legislative maps were unresponsive to population changes over the years and often overrepresented more sparsely populated rural counties in comparison with their more densely populated urban counterparts.

The U.S. Supreme Court cases ushering in the “one-person, one-vote” principles that prioritized equal population in districts effectively determined that political boundaries such as counties could no longer serve as the sole basis on which districts were drawn.footnote1_YthL7iCIL8qGeAyLKyAbRhKBxTEQx6TbCb2niCQvA2o_dwLwGfncWEhN1 Justin Levitt, “Redistricting and the West: The Legal Context,” chapter 2 in Reapportionment and Redistricting in the West, ed. Gary F. Moncrief (Lexington Books, 2011), 16. The phrase “one person, one vote” is from Gray v. Sanders, 372 U.S. 368 (1963), in which the U.S. Supreme Court rejected Georgia’s use of the “county unit” system of primary elections.  

Many states still consider the preservation of political geographies such as counties, municipalities, or townships in redistricting.footnote2_hVSMQOA6HT1PzNZdseLiHVvhi38WKZaVdd6RiE0_eW2QnAGEjYXt2 Our review of state constitutional and statutory text shows that 78 percent of references to county preservation are found in state constitutional text. See figures 1 and 2.  States and their courts regularly recognize the significance of counties as a unit of governance. For example, the North Carolina Supreme Court in its 2002 decision in Stephenson v. Bartlett quoted a ruling from 1884 to deem counties essential to a state’s political organization, arguing that “it is through them, mainly, that the powers of government reach and operate directly upon the people, and the people direct and control the government.”footnote3_f4tawhmcntcxWWuWNRjz8oQCIBaLyv2lQX5DqfirN4_xHUKOrI0PhKa3 White v. Commissioners of Chowan County, 90 N.C. 437, 438 (1884) qtd. in Stephenson v. Bartlett, 355 N.C. 354 (N.C. 2002).  However, the federal precedent now requiring equal population as the basis for drawing districts relegated the question of whether to preserve smaller, state-specific political boundaries in redistricting to state governments and, ultimately, to the political complexities of the redistricting process.

States manage county preservation for redistricting in three general ways: by making no mention of county preservation, by making county preservation a discretionary criterion, or by making county preservation mandatory. In this analysis, we sort states into one of these three categories in each redistricting cycle between 1990 and 2020 for each legislative chamber in the state.

Most states either make no mention of or require only discretionary consideration of county preservation in their redistricting guidelines. The largest number of states with mandatory preservation criteria in any given decade was eight in the upper chamber from 2000 to 2010 and eight in the lower chamber in the same decade. Table 1 shows the total number of states in each category from 1990 to 2020 for both the upper and lower legislative chambers.


States with discretionary preservation guidelines typically use language that instructs map drawers to preserve whole counties “to the extent possible,” as does California since the adoption of its independent redistricting commission in 2008.footnote4_c4V7GGO5zqfwkzl-9clwVd7kHM3qrFNd3NnM1Siw3sk_liqGZZBZdWpq4 California Constitution Art. 21 § 2(d)(4).  Other common phrases that signal discretionary county preservation criteria include “where feasible” (Florida) or “as is reasonably possible” (Colorado).footnote5_QM73PD5iD7m4C9B7P3DqucsZz8sOA3Fj8lUVrHwh8AI_oNFcBErRuOUE5 Colorado Constitution Art. 5 § 48.1(2)(a); Florida Constitution Art. 3 § 21.

We designate states like Texas — which requires that for state house districts, “whenever a single county has sufficient population to be entitled to a Representative, such county shall be formed into a separate Representative District” — as having mandatory preservation criteria.footnote6_zxDl224ox4wmxhmVDU3Abzsamnft6sxywLYBgqUjaE_y2HZ64zUZNZJ6 Texas Constitution Art. 3 § 26.  Similarly, Kentucky requires that districts must be drawn “as nearly equal in population as may be without dividing any county, except where a county may include more than one district” and lacks any qualifying language typical to discretionary preservation states.footnote7_ScPxQcWefXSZqMFdA3n83KYYmdfHDu9wcNheqb5fXjg_grLRweS0qQL37 Kentucky Constitution § 33.

The application of mandatory county preservation criteria, however, is perhaps best exemplified by the Pennsylvania redistricting commission’s 2011 legislative maps. The state’s supreme court found in Holt v. 2011 Legislative Reapportionment Commission that the plan, which operated under the state’s mandatory preservation requirement, contained “numerous political subdivision splits that [were] not absolutely necessary.”footnote8_owZ-23iI0dtGwCjNsrvYOagXuBRezWoDb61v9NM5yiA_sEE9qDWbLbGe8 Penn. Const. Art. 2 § 16; Holt v. 2011 Legislative Reapportionment Commission, 38 A.3d 711 (Pa. 2012).  In light of the court’s decision, the commission drew remedial maps that were in place for the rest of the decade.

While Pennsylvania’s county preservation guidelines are straightforward (though not always observed in practice), other states have unique schemes. North Carolina requires the identification and preservation of certain county clusters, a process that developed out of the state supreme court’s 2002 Stephenson ruling.footnote9_SUczvDYIQGG71QgrB-ZK86uzh5cp4XIgwzpMKLfMBcQ_dh73k4WA5LHe9 Daniel Carter et al., “Optimal Legislative County Clustering in North Carolina,” Statistics and Public Policy 7, no. 1 (2020): 19–29, https://scholars.duke.edu/publication/1406968.  Map drawers must first identify counties that could form a single district, then those that could create two whole districts, and so on until the list of counties that can contain whole districts has been exhausted.footnote10_o6C84xiHHGLwYFleq6j3OjeNVf8UcMpQdIoTmEnkGk_ntySnbnWoNdm10 Andy Jackson, “What ‘County Clusters’ Mean for North Carolina’s Redistricting Process,” Locke, September 10, 2021, https://www.johnlocke.org/what-county-clusters-mean-for-north-carolinas-redistricting-process.  They then must identify any groupings of counties that could together create a whole number of districts. Idaho, on the other hand, has discretionary county preservation criteria but requires, for any district that contains more than one county or a portion of a county, that “the counties or portion of a county in the district shall be directly connected by roads and highways.”footnote11_k1Zm0HDyzOneLeTUqmdYPmvhi96xXwogfIQ7YUvBneo_nKqNUYKlOPud11 Idaho Code §72–1506(9).  These idiosyncratic criteria demonstrate again the lack of standardization in how states consider county boundaries in redistricting.

Figures 1 and 2 map county preservation requirements from the most recent redistricting cycle, in 2020.

Often a change in the redistricting authority accompanies a change in county preservation laws. California, Colorado, and Michigan, which previously had no county preservation guidelines, revised their redistricting statutes to include discretionary preservation criteria after they created independent redistricting commissions in 2008 (California) and 2018 (Colorado and Michigan).footnote12_OAnXfqNBcdTyQlieR2r-8Y3vAJ8z1pHAXZj4c35QOYU_nIQcUUFUNaj712 See Proposition 11 Redistricting, California Proposition 11 (2008), http://repository.uchastings.edu/ca_ballot_props/1291; Amendment Z Legislative Redistricting, Colorado Amendment Z (2018), https://leg.colorado.gov/sites/default/files/initiative%2520referendum_final%20draft%20packet%20-%20amendment%20z.pdf; and November 2018 Ballot Proposal 18–2, Michigan Proposal 18–2 (2018), https://sfa.senate.michigan.gov/Publications/BallotProps/Proposal18–2.pdf.  Most states have made no significant changes to their county preservation criteria since the 1990s.footnote13_QSBkHKcaSJUluDVvDPCiqEkw7r7ClpD8SRlGqY8OqmA_lbGzSMrc0pvu13 Some states, including Arkansas (1936), New Jersey (1966), South Carolina (1895), and Wyoming (1890), have not updated the statutory or constitutional text governing redistricting law in quite some time, and the county-based redistricting schemes outlined in each of these states’ constitutions have been since found unconstitutional. In these states, state and federal court case law following Reynolds and one-person, one-vote jurisprudence have dictated the county preservation criteria for state legislative redistricting. See Faubus v. Kinney, 239 Ark. 443 (1965); Wells v. White, 274 Ark. 197 (1981); Scrimminger v. Sherwin, 60 N.J. 483 (1972); McNeil v. Legislative Apportionment Commission, 177 N.J. 364 (2003); Gonzalez v. State Apportionment Commission, 428 N.J. Super. 333 (2012); Burton v. Sheheen, 793 F.Supp. 1329 (Dist. S.C. 1992); Colleton County Council v. McConnell, 201 F.Supp.2d 618 (Dist. S.C. 2002); Brown v. Thomson 462 U.S. 835 (1983); and Gorin v. Karpan, 775 F. Supp. 1430 (D. Wyo. 1991). In light of these cases, we categorize these states on the basis of court decisions and not the constitutional text.

Montana has two competing sets of redistricting regulations. Its constitution requires only that districts consist of compact and contiguous territory and be as nearly equal in population as practicable.footnote14_3-IkthdRj6jCUsjBsZDZUbPZyDD1c-483Kze9ax8p9w_rynOyZsUkepx14 Mont. Const. art. V §14(1).  The state statues, however, include specific population deviation, contiguity, and compactness standards, as well as prohibitions on partisan gerrymandering.footnote15_EEY9hNUe5-A9jR7najH6NZT7tUDcEXN0OYFmpPSg4_oOVWcWA3oAsW15 Mont. Code Ann. § 5–1–115.  A 2015 law review article, coauthored by a former state supreme court justice and chair of the appointed redistricting commission, argues that the state statutory guidelines are unconstitutional and ignored in practice by the commission when it draws legislative districts.footnote16_1QnyzjMdjdmyp9YRrfZasQ-t0sfygkjCL-6tubBABFU_fBu2WdF4k7SV16 Caitlin Boland Aarab and Jim Regnier, “Mapping the Treasure State: What States Can Learn About Redistricting from Montana,” Montana Law Review 76, no. 2 (2015): 257–80, https://scholarworks.umt.edu/mlr/vol76/iss2/3.  In effect, this discrepancy is moot because neither set of regulations mentions county preservation.

In a few cases, map drawers asserted that they were emboldened to violate their states’ redistricting criteria — in one instance, the equal population criterion — even when those standards were discretionary at best, in order to preserve county boundaries. For example, in the 1990s, Ohio officials challenged the state’s legislative plan for deviating from population equality beyond what is allowable by the state constitution.footnote17_NEov-fHX04URjgQghzeVJtF4pNwzRUNATnvKezpMjIY_jlQN11S9DNKm17 Voinovich v. Ferguson, 63 Ohio St. 3d 198 (1992).  Ultimately the Ohio Supreme Court in Voinovich v. Ferguson dismissed these claims, ruling that “county boundaries had equal legal status to the population clause.” A separate federal challenge also found that “the board’s plan did not violate the one-man/one-vote provision” due to its deference to county preservation as rationale for doing so.footnote18_a3O-AWo6ZHan2OuvxSUBNWsbiwEHYVCb3ZGzkb2pag_r6pY9WYsWPEv18Voinovich, 63 Ohio St. 3d 198.

In contrast to Voinovich, a lawsuit challenging Missouri’s state senate maps after the 2020 census demonstrates how the flexibility of discretionary preservation criteria could allow redistricting bodies to split municipalities in pursuit of population balance across districts. After the Missouri judicial commission redrew the state senate map in 2022, voters challenged its constitutionality on grounds that it unduly split both Buchanan County and the city of Hazelwood into two districts. The Missouri Supreme Court ultimately upheld the decision of a state circuit court, which ruled that “splitting one county and one municipality represent the least amount of discretion — or, at worst, an appropriate amount here — that can be afforded any redistricting commission.”footnote19_qa7iidGyB3J3228-Y43JN2KbPnjEn3YyTtAEDlFEBQ_aB1hDW67YzbZ19 Faatz v. Ashcroft, 685 S.W.3d 388 (S. Ct. Mo. 2024), 23, https://statecourtreport.org/sites/default/files/2024–02/ashcroft-missouri.pdf.  The court affirmed that these splits were allowed and perhaps even expected, given the frequency of these exact splits occurring in different redistricting simulations.footnote20_0bYh6CUHVyaptDawpDONG7iI1HXSvti6PcPHi7Z8FLQ_waI4tqZ0LOv720Faatz, 685 S.W.3d 388.

As expected, states with discretionary preservation criteria often face legal challenges to the splitting of counties or other municipal governance bodies. Whether splits are excessive is largely left up to the courts and relevant precedent.

End Notes

Data and Methodology

Our analyses below are derived from legislative district shapefiles for elections between 1992 and 2022. We collected these shapefiles from two main sources: the National Historical Geographic Information System (NHGIS) database housed at the University of Minnesota and the American Redistricting Project’s archive of legislative shapefiles.footnote1_UGCV5xjc8KFb1IIE5ytrDB0gjZNHU8gj1qNN10J0V00_jNt4ZvsfqQJw1 See the National Historical Geographic Information System, “Download U.S. Census Data Tables & Mapping Files,” last accessed February, 2024, https://www.nhgis.org; Steven Ruggles, Sarah Flood, Matthew Sobek, Daniel Backman, Grace Cooper, Julia A. Rivera Drew, Stephanie Richards, Renae Rodgers, Jonathan Schroeder, and Kari C.W. Williams, IPUMS USA: Version 16.0 [dataset], 2025, https://doi.org/10.18128/D010.V16.0; and American Redistricting Project, “Map Archive,” last accessed May 2022, https://thearp.org/blog/map-archive.  For any missing data, we contacted the relevant state agency (e.g., the Texas Legislative Council) to collect legislative shapefiles.footnote2_wL-KmPVJXQu3pthsYyeTVdTr4xb3qVe-34vMX6w1k_eQXgPe7U8UwM2 We were unable to find shapefiles for the legislative districts in either chamber in Arkansas enacted before 2002. In six states, the first maps were enacted before the 1994 or 1996 elections.  All of the county shapefiles for each decade are available from the NHGIS or the U.S. Census Bureau.footnote3_SwDKtiLgsaYg6GWqda8vyDLDqXv6dHhNERLFaFlw3bs_iITxKhmVsPV13 See U.S. Census Bureau, “TIGER/Line Shapefiles,” last accessed December 2023, https://www.census.gov/geographies/mapping-files/time-series/geo/tiger-line-file.html.  We conducted all our analyses using the statistical program R.footnote4_3vIuo-sgK-3l471R7Zw7NJdOjkPbkqWrRE6Sd76dQc_tYbVfFd8w2KJ4 We ran geographic intersections of the district plan and the county boundaries for each state and legislative chamber. Our initial results included a great number of point and line intersections — where boundaries touched but did not have any area — and many minor map and projection discrepancies that artificially inflated the number of splits. We filtered out point and line intersections and intersection areas that amounted to less than 1 percent of the total district.

We added some contextual data to these geographic files. We first collected county and state total population estimates from each decennial census between 1990 and 2020. To account for any county that must be split into multiple districts because its population is too large for a single district, we estimated the number of expected districts within each county by relating the county population to the ideal district population. For instance, Orange County, California, had a population of 3,186,989 in 2020, and the ideal state house district size was 494,228 people. Therefore, we would expect the county to be split across 6.4 districts. The frequency of districts that include parts of multiple counties, which we report below, is the count of splits above the expected rate, controlling for the total population of the county. These estimates, in conjunction with the size of the legislative chamber, provide a baseline to assess the frequency of districts extending beyond county borders.

States with multimember legislative districts present a complication for our analyses. We opted to exclude district plans that contained multimember districts with varying numbers of representatives and therefore varying population sizes. In these plans, we cannot determine the expected number of splits when the district magnitude (i.e., the number of legislative seats in the district) is inconsistent, because we cannot assume the size of the county population that would be expected to reside in a district. We therefore excluded house plans from New Hampshire, South Dakota, and Vermont after 2004 and West Virginia before 2020, as well as senate plans from Nevada before 2012 and from Vermont. We retained multimember district plans in which the districts elect the same number of representatives across the state, as is the case in Arizona, Idaho, Maryland, New Jersey, North Dakota, and Washington.

End Notes

Findings

We looked for statistically significant differences (using p < 0.05 as the threshold) in the number of split counties above the expected rate across each chamber and redistricting cycle, comparing the three categories of county preservation. Across all four decennial redistricting cycles, the mean number of splits above expected was lowest in states that require mandatory preservation of counties.

Figure 3 shows the average number of split counties above expected in upper chamber districts for each preservation category. Figure 4 shows the average number of splits above expected in the lower chamber. Across the four redistricting cycles, states with mandatory county preservation criteria split significantly fewer counties than states with discretionary or no preservation criteria in all instances except the upper chamber in the 1990 cycle. During that cycle, mandatory preservation states had about one-tenth fewer splits in the upper chamber and three-tenths fewer in the lower chamber than states with no preservation criteria.

In the lower chamber maps, the average splits above expected for the discretionary preservation states were actually higher than they were in the states with no mention of county preservation in three of the four redistricting cycles. This difference was significantly higher in the 2000 cycle.


To complement the aggregate observations at the national level, we turn to states that in some way changed their statutory requirements to observe the effects of those changes.

In 2002 in the Stephenson decision, the North Carolina Supreme Court laid out a system to balance the state’s mandatory whole county provision and equal population requirements. Under this system, map drawers must group counties into geographically contiguous clusters that contain a whole number of districts.footnote1_E147NwxHJMnl6BFmBNVAoedh1gL6k18NWv78BtO0zU_sw7tsZnE3eCl1 N.C. Const. Art. 2 §§ 3, 5; Stephenson, 355 N.C. 354 (2002).  This allows us to compare rates of split counties before and after the decision. In the state house, North Carolina averaged 1.3 splits above expected in 1990, putting it around the median of all states; it averaged 0.73 splits in 2000, one of the lowest of all states. Following the Stephenson decision, North Carolina’s splits above expected dropped to the third-lowest (0.63) in 2010 and second-lowest (0.60) in 2020. In the state senate, North Carolina was also around the median in 1990 (1.2 splits above expected) but dropped to one of the lowest splits above expected after 2000 (0.73).footnote2_OO74xKIByxQpBlxOAsyZMBCLOOdzuUfEYaJUHcZ19Q_j6yIZ85EFukU2 North Carolina had the fourth-fewest splits above expected in 2000, fifth-fewest in 2010, and fourth-fewest in 2020. Notably, however, there was a minor increase in absolute splits across these decades, going from 0.71 in 2000 to 0.73 in 2010 and 2020.  The 2030 redistricting cycle will give us an additional decennial map to assess the county clusters put into practice by Stephenson.

Nine states made changes to their county preservation requirements during the period covered by this study.footnote3_9nwlp6hRYIHJwt0eM5wACeHUdfUiT2gAohVkgMOyz8_ov0EAIhdFc7Z3 California made a change in 2010, in both chambers; Colorado in 2020, both chambers; Florida in 2010, both chambers; Illinois in 2020, both chambers; Maine in 2000 and 2010, both chambers; Michigan in 2020, both chambers; Missouri in 2020, lower chamber; New Mexico in 2020, both chambers; and New York in 2000 and 2020, upper chamber.  California, Colorado, Florida, Illinois, Michigan, Missouri, and New Mexico changed from no mention of county preservation to discretionary preservation. Maine moved from no mention in 1990 to mandatory preservation in 2000 but settled on discretionary preservation in 2010 and 2020. The New York senate districts were covered by discretionary criteria in 1990 and mandatory criteria in 2000 and 2010, but in 2020 the state had no preservation criteria. Three of the nine states — California, Colorado, and Michigan — also adopted independent redistricting commissions at the same time as they revised county preservation criteria.

Looking only at these nine states, we do not observe a consistent effect of the change in county preservation criteria on the frequency of split counties. Instead, we see scattered effects. There was no marked change for the upper chamber in Illinois or New York, or for either chamber in California, Maine, or New Mexico. California, which changed its preservation requirements in 2010, maintained a consistent number of splits above expected in the upper chamber across all four decades, while its lower chamber saw minor decreases in the 2010 and 2020 redistricting cycles.

In the Colorado senate, the average splits above expected in 2000 and 2010 had decreased from 1990 by 0.20 and 0.25 additional splits, but in 2020, the cycle in which the state added discretionary preservation criteria, average splits increased back to 1990 numbers. In the house, the number of splits above expected consistently decreased from 1990 to 2010, making Colorado the state with the second-fewest splits above expected. In 2020, however, average splits increased back to the state’s 2000 numbers.

Similarly, Illinois saw relatively large increases in additional splits for both the upper and the lower chambers in 2020, the cycle for which it switched from no mention to discretionary preservation. Although the absolute change in county splits over time was not large, it made Illinois one of the states with the highest splits above expected. These findings underscore that the addition of discretionary preservation is not guaranteed to significantly lower the number of county splits during redistricting. Future work should consider the usefulness of discretionary criteria.

Across the four cycles of redistricting studied here, requiring mandatory preservation of counties during the state legislative redistricting process was the best way to guarantee a significant decrease in the actual number of county splits. That being said, the New York senate was the only case for which mandatory preservation criteria was in place for more than one redistricting cycle, limiting our ability to observe significant effects. We find that discretionary preservation achieved a middle ground between the other categories only in upper chambers, and the difference was significant in only three cycles.

End Notes

Conclusion

This research aimed to determine the efficacy of statutory requirements related to county preservation in legislative districting. Our results are unambiguous: States can reduce instances of split counties only by adopting statutory language that mandates county preservation. Discretionary preservation criteria are not guaranteed to keep counties intact. For the first three redistricting cycles studied in lower house maps, states with discretionary language actually had more county splits above expected than did states that had no mention of county preservation. Giving states discretion to preserve counties, then, means county lines are less likely to guide the hand of map drawers than mandatory preservation criteria.

We limited our consideration to states in which the number of representatives in a district did not vary and did not consider multimember districts with varying district magnitude. Allowing the number of representatives elected in a given district to vary could reduce the frequency of county splits.footnote1_nU3Sn4yeldFQgf6Kbjr1uA4rQ-gkJraQ0C6Cc9rz0_hKMauFTJta0G1 See Andy Craig, Counties and Representation in the Wyoming Legislature, Rainey Center, March 2024, https://www.raineycenter.org/policy-brief/counties-and-representation-in-the-wyoming-legislature.  For now, though, multimember districts are unlikely to become widespread in the United States. We also limited our analysis to decennial district plans. The frequency of county splits could be markedly different if we were to include intercensal district plans, a growing feature of the redistricting landscape. Indeed, intercensal districting is designed to repair some deficiency in the decennial plan, which can involve the visual presentation of districts and how those districts crisscross the state.

In sum, we have only begun to understand how redistricting requirements relate to the actual districts that result from them. We aim to continue this line of research and broaden our understanding of how statutory text can either give map drawers a guide out of the political thicket of redistricting or trap them in a set of conflicting criteria.

End Notes