

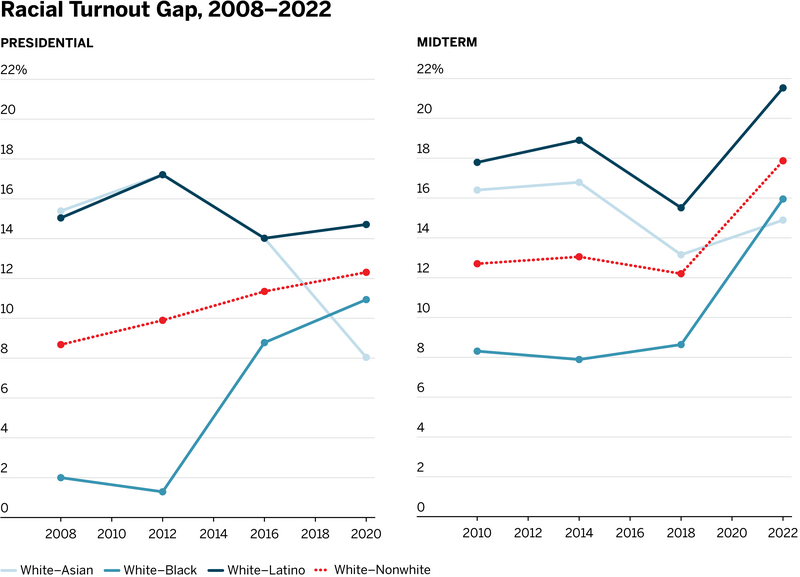
A new report from the Brennan Center shows just how far we are from fulfilling the country’s promise of a democracy equally open to all Americans. The racial turnout gap — the difference between white and nonwhite turnout rates in elections — has been consistently growing since at least 2008, reaching 18 percentage points in the 2022 midterm elections. If the gap did not exist, nearly 14 million additional ballots would have come from voters of color that year.
And although the 2022 midterms saw the largest gap in recent years, the disparity in turnout isn’t new: the 2012 election was the only election in recent times to reach near parity between the turnout rates for Black and white voters, and at no point in at least 16 years has the turnout gap closed for any other group.
To better understand how the racial turnout gap has grown across the nation since 2008, we used nearly 1 billion vote records between 2008 and 2022. This voter snapshot data offers a better understanding of turnout compared to even the largest survey samples. The data also helped us observe how regional and socioeconomic factors influence the racial turnout gap. We found evidence that the ballot box reflects the voices of different racial groups at decidedly unequal rates, disproportionately uplifting white citizens.
While the turnout gap has never fully closed, it was smaller during the Obama presidential years than today. In presidential elections, the racial turnout gap has grown consistently since at least 2008 (the first election for which nationwide voter files are available). In 2008 the gap was 9 points, and by 2020 it had grown to 12 points. Things were no better in the midterms: in 2022, even with the second highest turnout for a midterm election in 20 years, both the white-Latino gap and white-Black gap were the largest they have been since at least 2010.
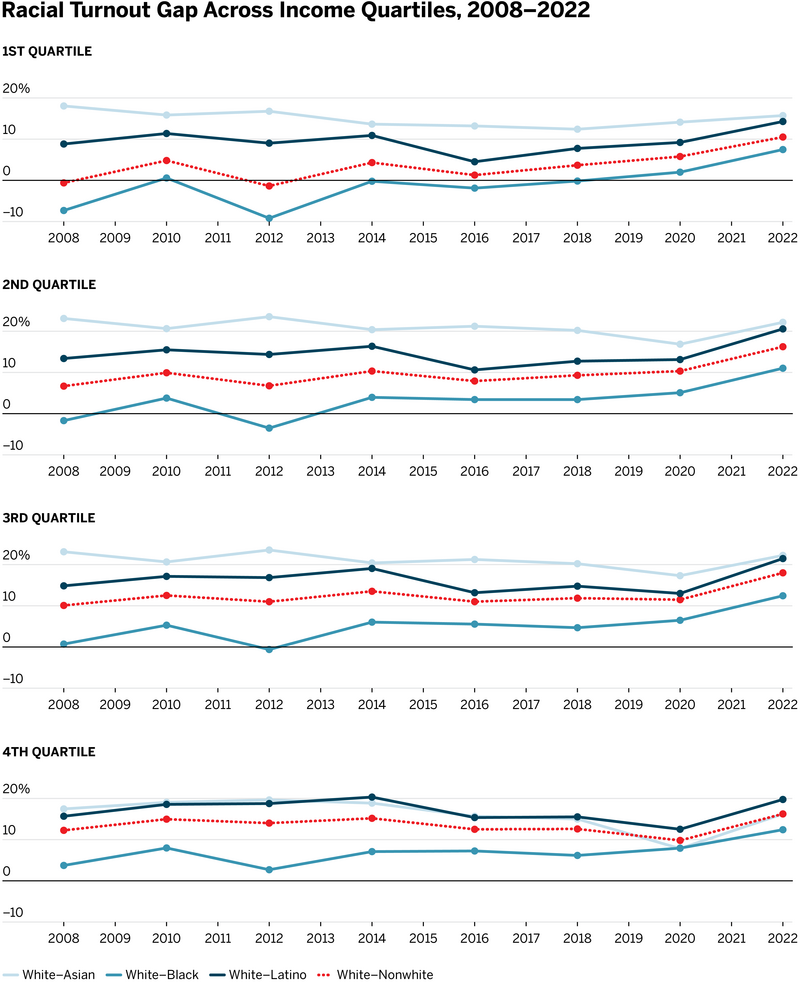
Importantly, these turnout gaps exist even when accounting for regional differences, income, and education. Though these factors account for some of the gap, they cannot fully explain it. White voter turnout has exceeded that of any nonwhite group since 2014 in every geographic region. While turnout tends to vary based on a neighborhood’s median household income and proportion of residents with a college degree, we still find racial turnout gaps in high- and low-income neighborhoods alike. The same is true of neighborhoods with high and low levels of education.
Myriad factors drive the nationwide racial turnout gap, like political disaffection, high rates of incarceration, inaccessibility at polling places, and language barriers, among other disenfranchising forces. However, the widening of the gap is occurring alongside a wave of restrictive voting laws going into effect. Within the past decade alone, almost 100 restrictive voting laws have been enacted in at least 29 states. And the mounting attacks on democracy are not felt equally by all — when access to the ballot is restricted, voters of color are more likely to be disenfranchised.
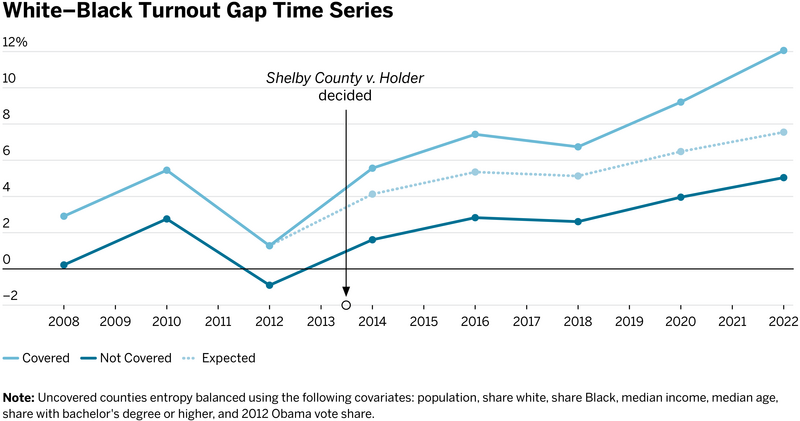
One key driver of the growth in the turnout gap in recent years is the Supreme Court’s 2013 decision in Shelby County v. Holder. The decision severely weakened the Voting Rights Act by gutting Section 5, which required federal approval for any changes to election rules and practices in areas with a history of racially discriminatory voting policies, a process known as preclearance. Pointing to Black turnout surpassing white turnout in covered states in the 2012 election, the ruling claimed that federal approval was no longer necessary to protect the right to vote.
The same day the Supreme Court announced its decision, Texas passed a discriminatory voter ID law that had formerly been blocked by the federal government. Mississippi, Alabama, and North Carolina soon followed with similar legislation that established voter ID and other restrictive voting laws aimed at Black communities. A federal court later described North Carolina’s law as “target[ing] African Americans with almost surgical precision.” The decision also allowed for many more local changes to go unchallenged. Prior to 2013, county administrators needed permission to move polling places, draw school board districts, and make other administrative and policy changes.
We use advanced statistical tools to prove the cumulative, negative effect of all the changes made in the aftermath of Shelby County. As the chart below shows, the changes in the white-Black turnout gap moved in tandem in counties that were covered and not covered by Voting Rights Act approval requirements during the years before Shelby County. After the decision, however, the gap has grown more quickly in the formerly covered counties. Though the racial turnout gap has increased everywhere since the Shelby County decision, it has grown almost twice as quickly in formerly covered jurisdictions than in similar, non-covered ones.
In fact, the white-Black turnout gap in formerly covered regions was 5 percentage points greater in 2022 than it would have been if the preclearance had applied, while the white-nonwhite gap was about 4 points higher. These gaps are especially significant in light of the fact that, according to Brennan Center research, since Shelby County was decided at least 62 Senate, gubernatorial, and presidential races in the states containing areas subject to preclearance have been decided by fewer than 5 percentage points.
We show that these effects were largest in counties where state and local practices were constrained by Section 5, as well as in counties that had racially discriminatory policies blocked by Section 5 in the years before the Shelby County decision. The effect is clear: the ruling cost hundreds of thousands of votes from voters of color in formerly covered counties in the 2022 midterm election.
Discriminatory voting policies and practices further remove us from America’s vision of a representative democracy. These laws target voters of color, likely increasing the racial turnout gap, impacting the ability of communities of colors to elect representatives that are responsive to their needs. Despite the Supreme Court’s view that racial differences in political participation are a thing of the past, this study provides compelling evidence that the Shelby County decision has accelerated this disturbing trend in democracy.