

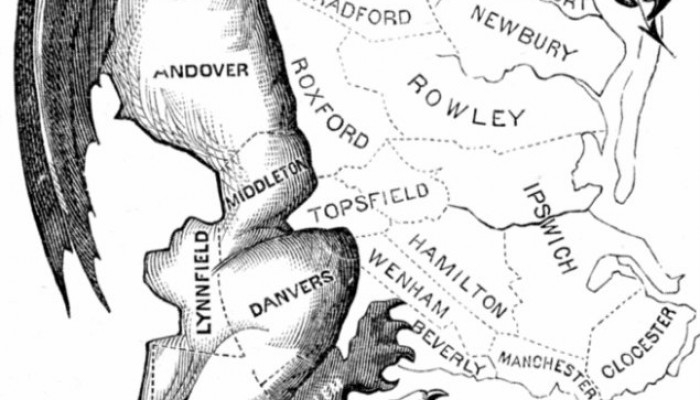
Figure 1: Tisdale, Elkanah. “The Gerry-Mander,” Boston Gazette, March 26, 1812.
What is extreme gerrymandering?
Gerrymandering describes the intentional manipulation of district boundaries to discriminate against a group of voters on the basis of their political views or race.
The term dates to 1812 when Massachusetts Governor Elbridge Gerry signed into law a redistricting plan that included a district many thought looked like a salamander, leading opponents to nickname the district after him.
But while the term has become a synonym for redistricting abuses, it actually covers a wide variety of sins, not all of which are related.
For example, one form of gerrymandering involves drawing districts in order to protect incumbents. Likewise, sometimes districts are drawn to ensure a favored candidate can successfully run for office. These types of gerrymanders – which often occur through bipartisan collusion between political parties – can be harmful to democracy by pre-determining outcomes and depriving voters of a meaningful choice at the polls.
But the partisan gerrymandering cases currently in front of the Supreme Court – Rucho v. Common Cause, Rucho v. League of Women Voters of North Carolina, and Lamone v. Benisek – involve another variant of political gerrymandering that is even more pernicious.
In the type of extreme partisan gerrymandering being challenged in North Carolina and Maryland, a political party uses its control of the process to artfully craft maps that lock in an outsized share of seats for an entire decade. The lasting and harmful effects of extreme partisan gerrymandering are especially apparent in traditionally purple states, like North Carolina. At a statewide level, North Carolina is a robust democracy with highly contested elections for everything from president to state auditor. But over the last decade, Republicans secured supermajorities in the state legislature, as well as a safe, durable 10–3 advantage in the congressional delegation.
Extreme partisan gerrymanders not only bake in results, but also result in maps that are deeply unrepresentative. John Adams famously wrote in 1788 that the House of Representatives – and by extension state legislatures – should be a “exact portrait” and “miniature” of the people as a whole. That doesn’t happen when district boundaries are manipulated in this way.
How does extreme gerrymandering work?
People often associate gerrymandering with the creation of super-safe districts that a party wins by overwhelmingly large margins. But, in fact, making districts too safe makes it hard to do an extreme gerrymander. Rather, the goal of a party seeking to use an extreme gerrymander to grab a disproportionate share of seats is to spread its supporters out among districts, letting it win a larger number of seats.
But, alternatively, you also could draw the districts in a way that Democrats end up with all four seats – essentially trading super-safe districts for more seats.
Of course, there is a danger for gerrymanderers. The trick is not to spread your voters out so much that districts become vulnerable to flipping to the other party in the normal give and take of electoral politics.
Fortunately for gerrymanderers – and unfortunately for the rest of us – this is becoming easier to do with “Big Data” and advancements in technology. And when gerrymanderers succeed, they create the worst of all worlds – a map that both is uncompetitive and skewed in favor of one party.
How can you tell when a map is an extreme gerrymander?
Although people often focus on individual districts when they talk about partisan gerrymandering, the extreme gerrymandering being challenged in North Carolina and Maryland also involves looking at the map as a whole to gauge whether a map results in an unfair allocation of seats between parties.
Mathematical and statistical measures can be powerful diagnostic tools that can help courts identify when a particular distribution of seats is statistically unlikely to be random – or at least when a map needs to be looked at more closely. Computer simulations that create hundreds and even thousands of random maps also can help point to situations where something is likely amiss.
But statistical bias is not the end of the inquiry.
Courts can also look to other types of evidence – including legislative materials, floor statements by lawmakers, and emails – to help determine whether or not maps have been drawn in a way that can’t be explained by neutral considerations.
Likewise, a state whose map is being challenged can present evidence to show that the bias in a map was due to things other than the intent to maximize partisan advantage.
Doesn’t the fact that Democrats are concentrated in cities explain why Republicans get more seats?
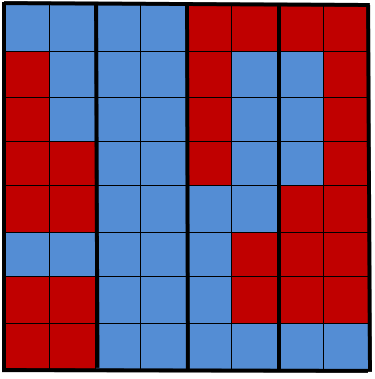
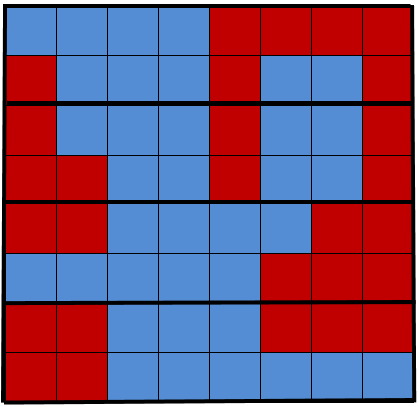
No. It’s true that big cities like New York and Los Angeles are heavily Democratic. And it’s true that residential patterns – or so-called clustering – may have some impact on the number of seats each party has. But there still are plenty of opportunities to gerrymander in areas outside big cities. In fact, Princeton professor Sam Wang shows how easily this is possible when there are significant pockets of both parties outside the big cities if there is a relatively even spread of partisans in those areas:
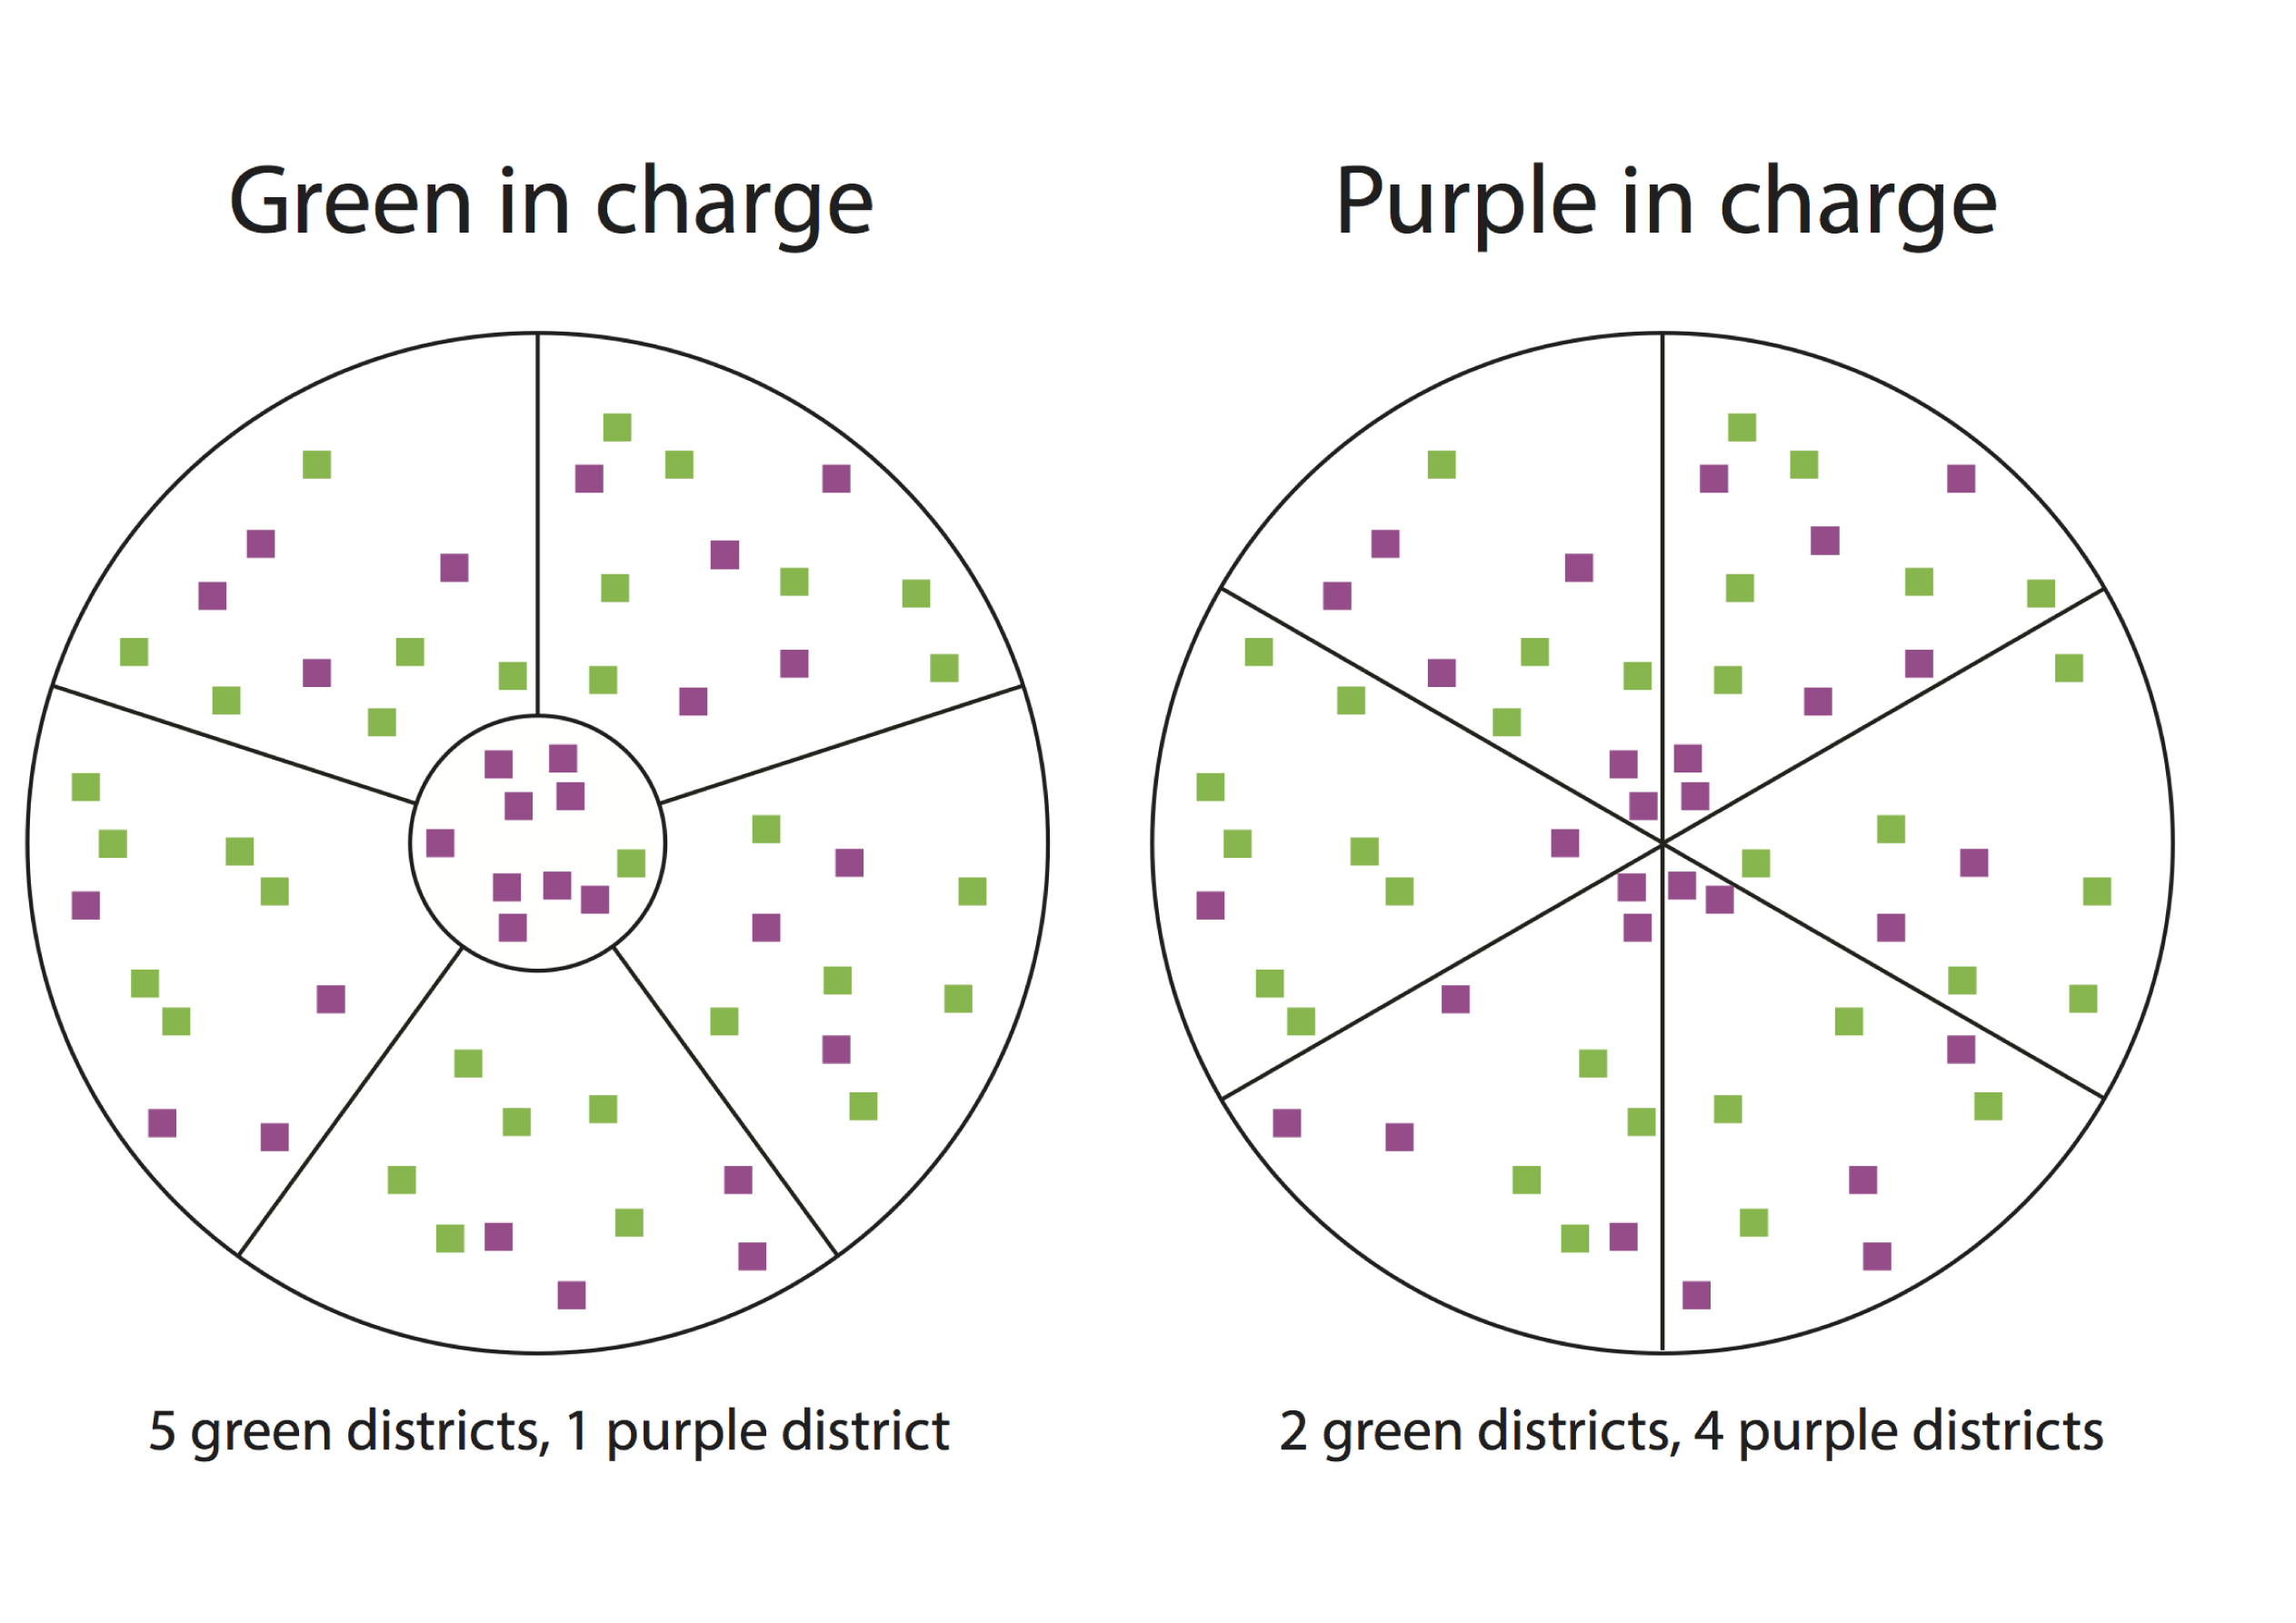
Figure 2: Sam Wang (@SamWangPhD). 2017. “This population can give a 5–1 split…or 4–2 the opposite way…all w/nice boundaries. Need more than maps to solve.” Twitter, August 25, 2017, 1:53pm.https://twitter.com/SamWangPhD/status/901155535541723137.
In fact, it’s notable that extreme gerrymanders occur not in deeply red or deeply blue states but in battleground states like Wisconsin, Michigan, North Carolina, and Pennsylvania, that aren’t starkly clustered but that just happened to be controlled by a single party at the time of redistricting. To be sure, the cities in those states are fairly to heavily Democratic, but, as a precinct level map will show, these battleground states also have a lot of Democrats in suburbs, college towns, and rural areas. Given this comparatively even spread of Republicans and Democrats, it absolutely matters how you draw districts. Draw a district heading one direction, you end up with a Democratic or at least a competitive district. Draw it in the other direction, and you have two safe R seats.
A great real-world example is in Cumberland County, North Carolina, where the city of Fayetteville currently is split between two congressional districts.
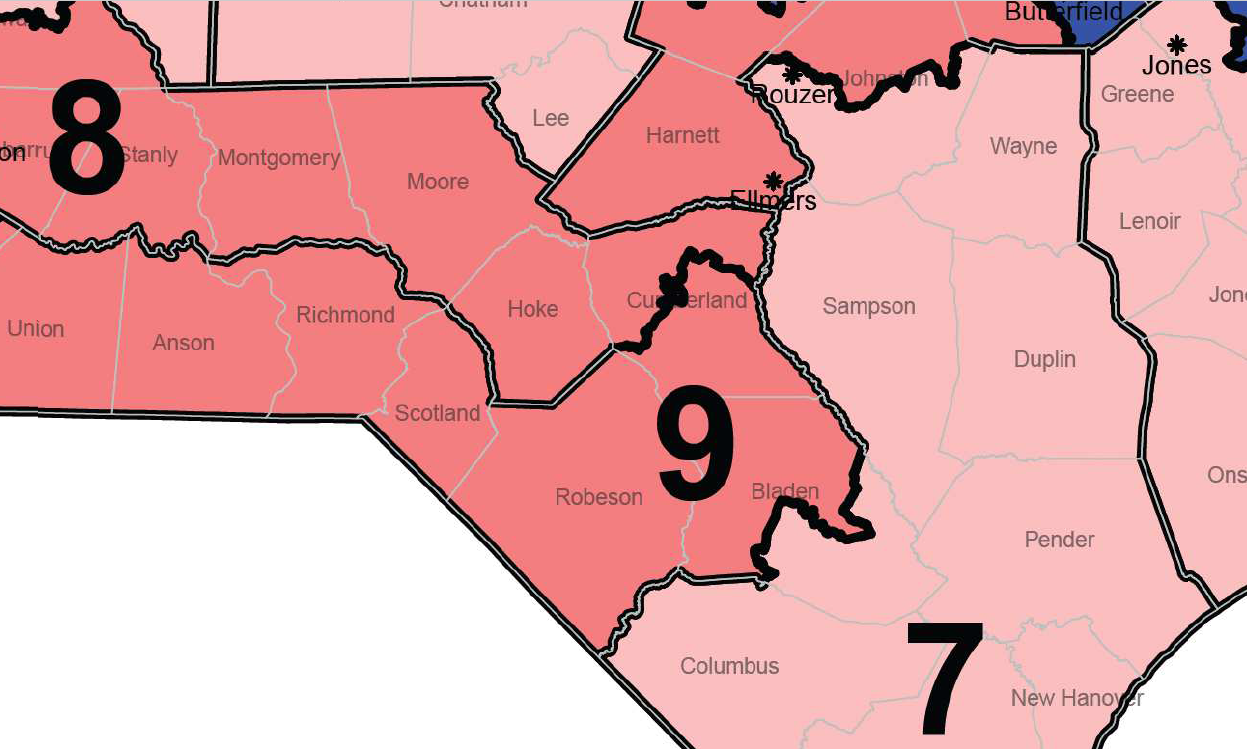
Figure 3: Supplemental Declaration of Jowei Chen, 3, League of Women Voters of North Carolina v. Rucho, No. 16-cv-01164 (M.D.N.C. July 11, 2018).
If Fayetteville had not been split in this way, it may have been possible to have a competitive district for Democrats in the area, in part, due to a nearby cluster of Democratic voters in Hoke and Robeson Counties.
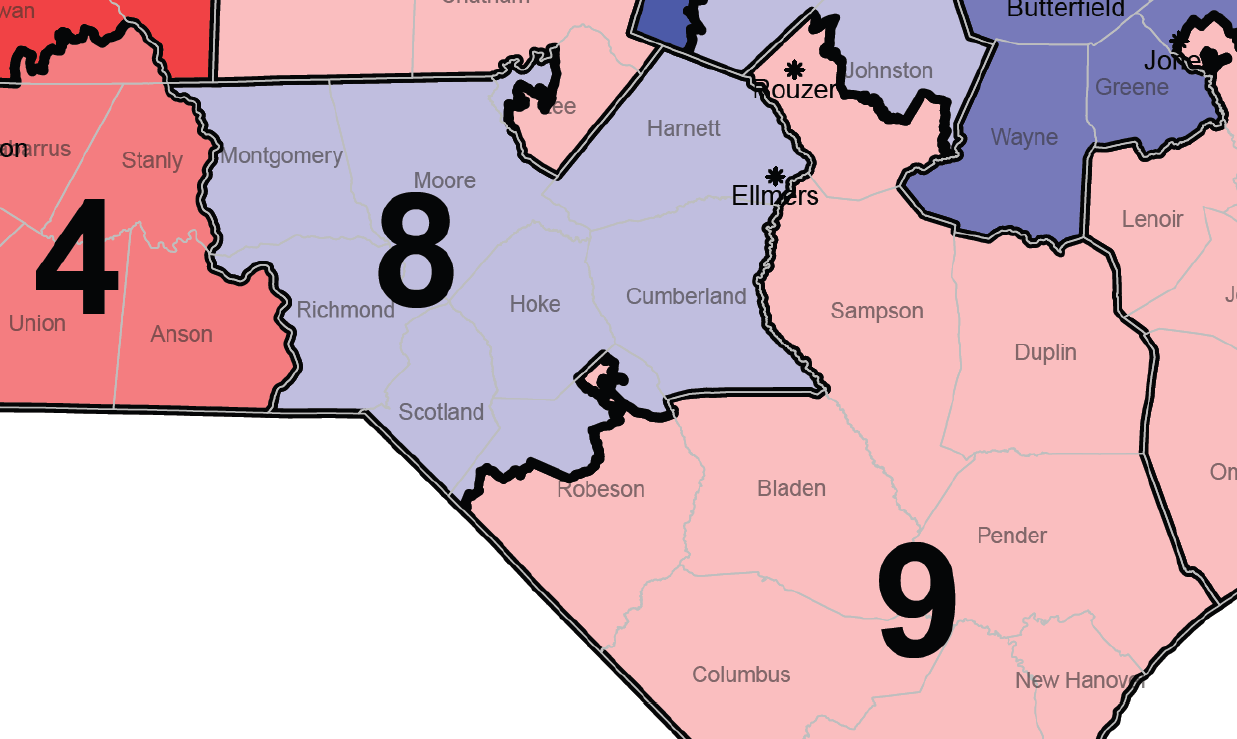
Figure 4: Supplemental Declaration of Jowei Chen, 2, League of Women Voters of North Carolina v. Ruch, No.16-cv-01164 (M.D.N.C. July 11, 2018).
And in the Midwestern battleground states, like Wisconsin and Michigan, the geography is even more favorable for creating Democratic, or at least highly competitive, districts. (It would be different if every census block outside of the big cities were uniformly, say, 56% / 44% Republican over Democrat, but that isn’t the case.)
One final point: It’s telling that the problem of high partisan bias is closely correlated with single-party control of the redistricting process. Contrast that with states that where commissions, split control legislatures, and courts draw maps, which have much lower – and much less durable – levels of bias. California had high levels of bias in the 1990s when Democrats controlled drawing of the maps. It has negligible levels today.