


Numerous factors explain how Democrats decisively took back a majority in the House of Representatives last Tuesday. But one deserves particular attention: Nearly three in four of the seats Democrats flipped were in districts drawn by redistricting commissions or courts. Districts drawn through these fairer processes were far more competitive than those drawn by legislatures in states where one party had sole control and could use it to gerrymander.
We found that commissions or courts drew 44 percent of all districts nationwide, but they drew 72 percent of the districts that Democrats flipped or are leading in with votes still being counted.
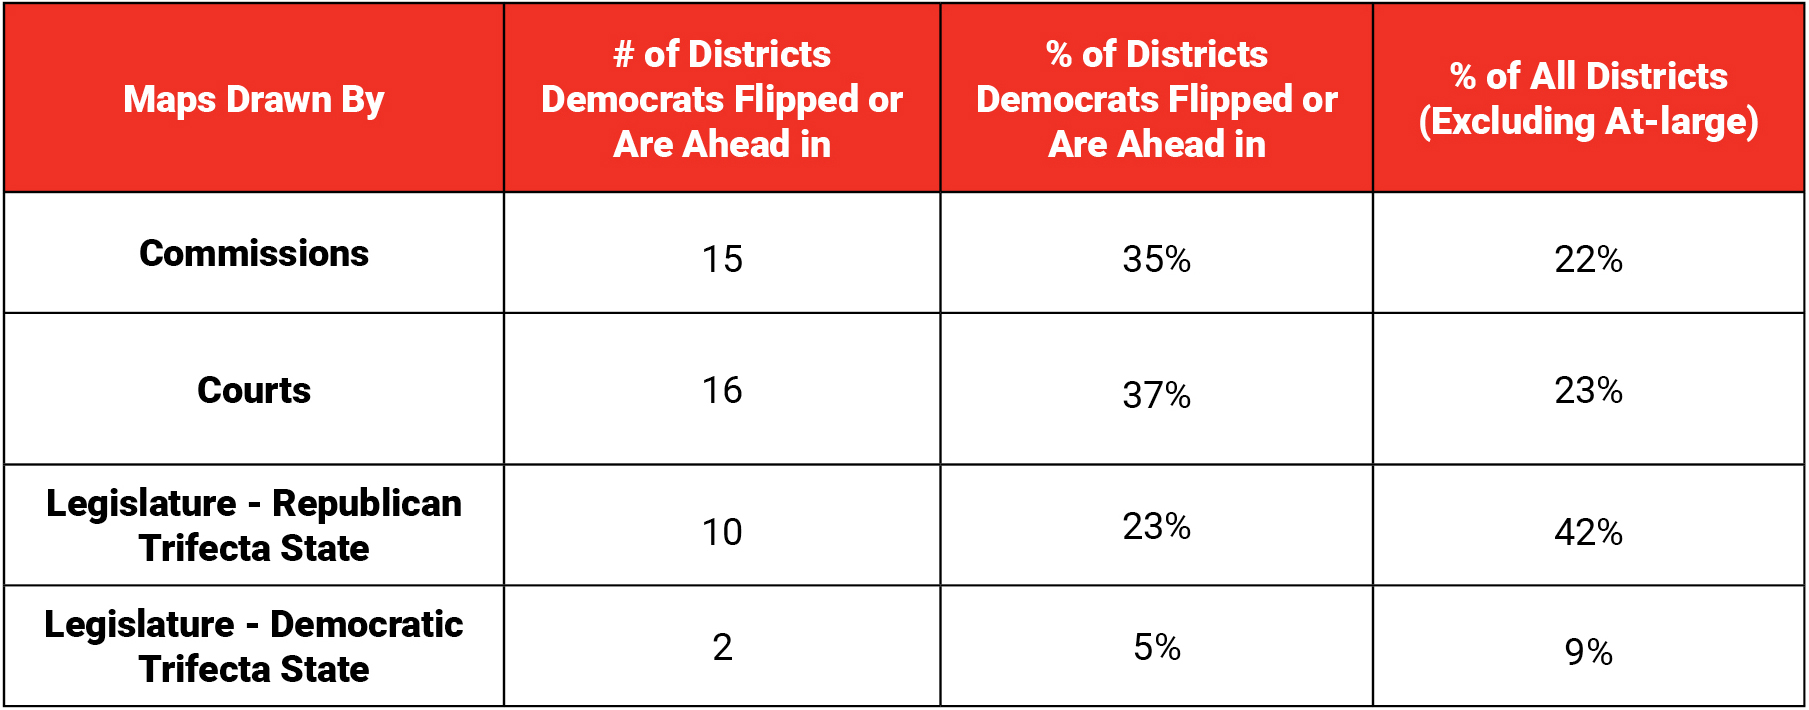
By contrast, legislatures in states where Republicans enjoyed unified control drew 42 percent of districts nationwide, but they drew just 23 percent of the districts Democrats flipped or are leading in. (The percentages exclude states with only a single district).
Out of the nine Democratic pickups on maps drawn by Republicans, none were in North Carolina (although election controversies may require another election in NC-09) and Ohio, and only two were in Michigan — the three states rated by the Brennan Center as being the most extremely gerrymandered.
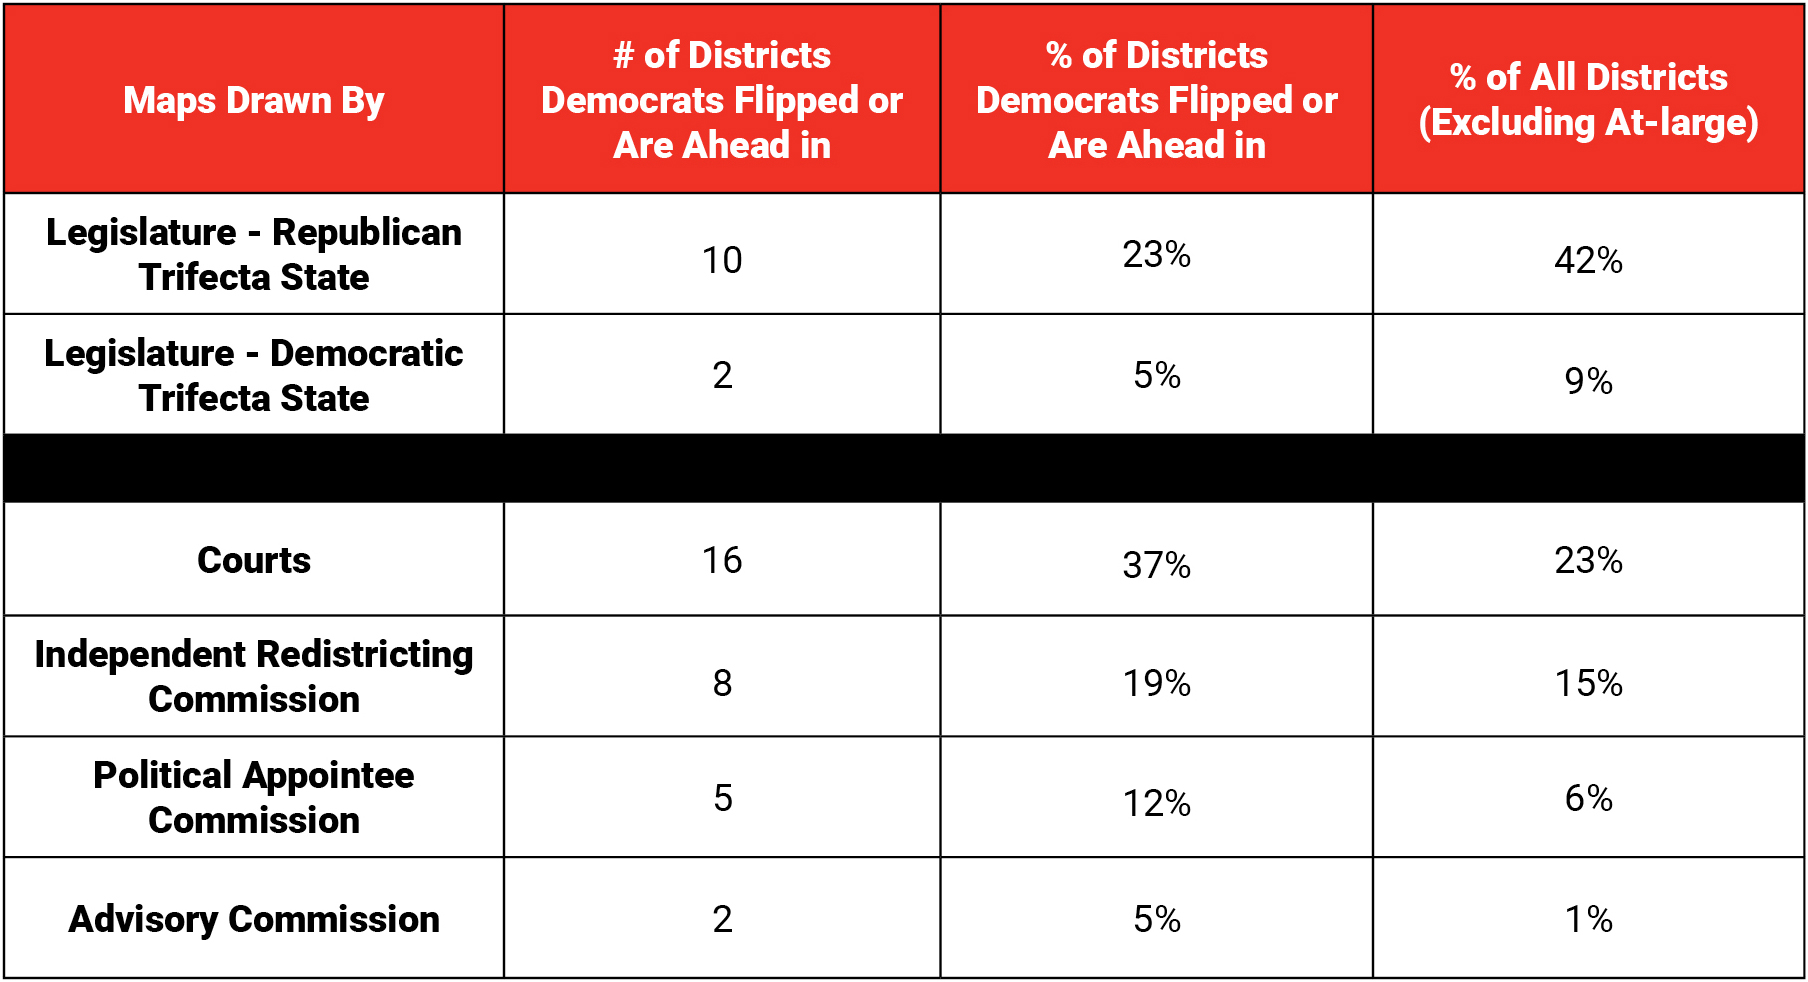
Delving more deeply into the analysis, the Brennan Center groups the 435 House seats into seven different categories based on control of the map-drawing process. Our pre-election analysis revealed that courts, commissions, and split-control governments were nearly four times more likely to draw super-competitive districts than lawmakers who had one-party control of state government.
Seats in Virginia and Florida, where congressional maps have been modified by courts, were especially pivotal Tuesday. In fact, Democrats did particularly well nationwide in states with court-modified maps, flipping a whopping 16 seats where courts either ordered redraws or stepped in after legislative deadlock. Republicans also benefited from the fairer competition created by courts, netting their only three pickups of the cycle in states with court-modified maps.
Here’s the full breakdown:
Updated after the election on December 7.
(Image: BCJ/Getty/Shutterstock)