


Since 2015, we have written eight major reports on crime trends in the United States. Now that the Federal Bureau of Investigation has released final data on crime in 2016, we looked back to examine how accurately our analyses have estimated crime trends nationally and locally. And, we wanted to answer some frequently-asked questions about our work.
What Do Brennan Center Crime Reports Analyze?
Our reports have estimated crime trends in 2015, 2016, and 2017 in the 30 largest American cities. We focus on this group because it provides a representative sample of big cities, and can help to capture trends in those cities and in the nation as a whole. Each of our reports collects data from city police departments. It then projects out where crime will stand in each city by the end of the year based on past years’ trends.
Why Do We Put These Reports Together?
Annual FBI crime data are released through the Uniform Crime Reporting Program (UCR), and are generally published in September of the following year. Given the significant lag time of this release, our analyses are designed to give the public and policymakers an idea of what to expect in the nation’s 30 largest cities — and of coming national trends — ahead of the FBI release. An early glimpse of the numbers provides sorely-needed facts amid increasingly common misstatements about crime trends.
How Does Our Data Compare to the FBI’s Final Tally for a Given Year?
Each year, we release a preliminary crime analysis in the fall, estimating where crime will stand by the years’ end based on the best available data. We then release an update in late December, and a final report the following spring.
Table 1, below, compares our estimates to final data reported from the UCR.
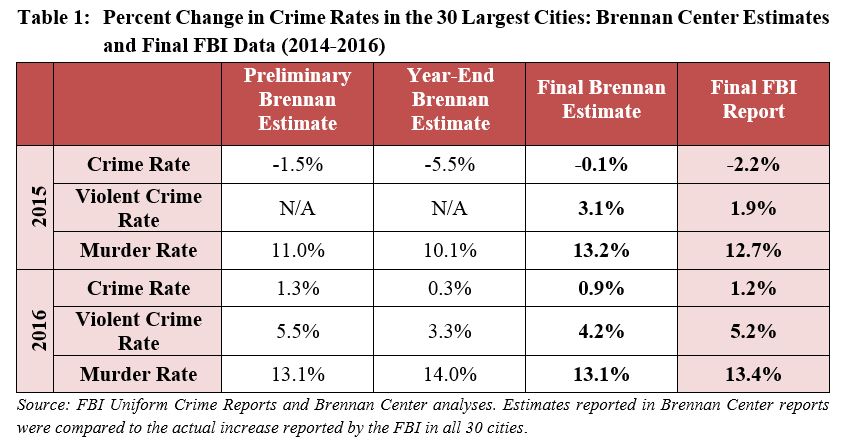
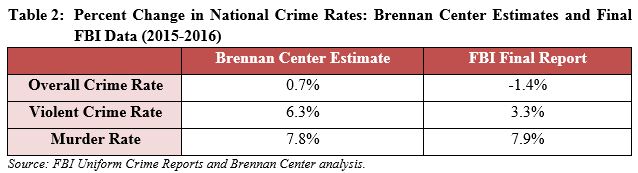
Brennan Center estimates have been very close to the final UCR data. Our analyses showed an uptick in murder rates for 2015 and 2016, within one percentage point of the FBI numbers. Crime and violent crime estimates were also within two to three percentage points of the UCR. The trends we found for these two years bore out in national FBI data (big cities, small cities, and rural areas) as well (as shown in Table 2 below): an uptick in murder, slight increase in violent crime, and stable rates of overall crime.
Most of our city estimates were equally close. In some cases, they differed from the final numbers, some coming in slightly lower and others coming in slightly higher. For example, in 2016, we estimated that Houston would have 44 more murders than it did. But our initial estimate for Chicago was 38 murders too low. This spread shows that our estimates do not systematically over- or under-estimate crime. As a result, our estimates for the entire 30-city samples tend to converge and remain on-target.
In 2016, we also released an additional report, Crime Trends: 1990–2016, which went beyond our 30-city analyses and estimated national crime rates. Table 2 compares that report’s national estimate with the final FBI data. The estimated change in the national murder rate was extremely close to the final FBI numbers. In the case of crime and violent crime, we slightly overestimated the increase.
We recently released our preliminary report on crime in 2017. That report showed slight declines in all crime rates: overall crime (-1.8%), violent crime (-0.6%), and murder (-2.5%). We will update those estimates at the end of the year and again in the spring.
Where Do We Get Our Data?
We collect data directly from city governments and CompStat reports, public releases by city police departments that track crime throughout the year. Some cities, however, don’t share CompStat reports and do not respond to our data requests in time for publication of our reports. In those cases, we sometimes use open-data portals — government-run websites that report crime, incident by incident, on a rolling basis. Previous reports have used open-data portals to collect numbers for Baltimore, Chicago, and Detroit, among others. City police officials have assured our team that open-data portals are reliable and quickly-updated, but just to be safe, we build in a “lag time,” and do not collect recent data that is likely still being updated. This minimizes the risk of incomplete data caused by slow reporting. The more data that is available from cities, the more accurate the estimates will be. We use the best available data for our reports.
Are There Risks in Estimating Annual Crime Rates with Partial Data?
Some academics warn against estimating yearly crime rates using partial data. They point out that it would be wrong to look at six months’ worth of data, and assume that trends would continue unchanged through the end of the year, especially given the “seasonal” nature of crime. We agree, and the method we use in our reports is specifically designed to minimize this risk. For each city, we use partial-year data as a starting point, and incorporate trends that show how crime has varied in that city in the past. This helps correct for seasonal trends and possible under-reporting. You can read more about this approach on page 6 of our most recent report.
* * *
Our research team studies the same 30 cities every time, and releases a transparent analysis of the numbers three times a year — in the fall, at the end of year, and then a final report in the following spring. If the data shows an increase, our analysis will say so. The same goes for a decrease in crime. The purpose of the Brennan Center analyses is to accurately report and estimate crime rate trends in a timely, unbiased way.