


Introduction
It is early in the 2014 election cycle, but already we are seeing spending patterns that shed light on whether some of the many speculations about this year’s political landscape are accurate. So far this cycle, expensive Republican primaries have often featured Tea Party candidates, but for the most part, they have been out-fundraised. Candidate-specific super PACs are providing new opportunities for big donors to spend at far higher levels than candidate contribution limits allow. The Brennan Center’s analysis of quarterly Federal Election Commission (FEC) campaign finance filings in 16 competitive primary races yields data on these and other issues:
- A large majority of high-dollar primaries are Republican contests: 12 of 16. Within the 12 Republican primaries, at least two-thirds have been identified as having a Tea Party candidate. All but two of the Tea Party candidates included in this analysis have been significantly outraised by primary opponents. In the four races where candidate self-financing did not play a major factor, Tea Party candidates on average were outraised by a margin of almost 2 to 1, with Tea Party candidates raising just over $650,000 on average and other candidates raising almost $1.2 million on average.
- One contest suggests that the crucial role of candidate-specific super PACs in the 2012 presidential election may foreshadow a greater role for them in Congressional races. Candidate-specific super PACs dominated outside spending in FL-19, where virtually all the independent expenditures came from single-candidate groups. The pattern of giving illustrates the concern that candidate-specific super PACs can be vehicles for circumventing contribution limits: three individual donors who maxed out on direct contributions to their favored candidate’s primary campaign also bankrolled single-candidate groups with donations ranging from $160,000 to almost $1.6 million.
- In high-dollar races so far, self-financing by candidates is a major factor: 27 percent of money raised came from candidates themselves. In the 16 high-dollar primaries, 12 candidates have already spent $200,000 or more on their own bids, and four candidates have plowed more than $1 million into their campaigns.
- Small contributions are a relatively insignificant aspect of fundraising in high-dollar races: only 9 percent of funds came from donors of $200 or less.
- In most races, outside spending was only a small percentage of total spending or nonexistent, but in recent elections, independent expenditures have peaked in the weeks before an election, so the fact that few races have seen high independent spending is not particularly surprising. The pattern of last-minute outside spending was starkly illustrated by one race, FL-19, where independent expenditures in the three weeks prior to the election were five times the amount for the entire first quarter.
- Dark money continues to be a factor where there has been significant outside spending: 45 percent of independent expenditures in the first quarter came from groups that disclose either none or only some of their donors.
Of course, all first-quarter spending was completed before the blockbuster Supreme Court decision in McCutcheon v. FEC. At the conclusion of this document, we discuss in further detail how that decision may impact the patterns identified in this analysis.
The 16 races were selected from a longer list of competitive primaries compiled by the Sunlight Foundation, which categorized a primary as competitive if there were two or more viable candidates, meaning candidates that had raised $100,000 by the end of 2013. Our analysis includes all competitive races where the viable candidates together raised more than $2 million as of the end of March 2014. The 16 races in our analysis are therefore among the races with the highest levels of money raised in House primaries so far.[1]
I. Candidate Fundraising
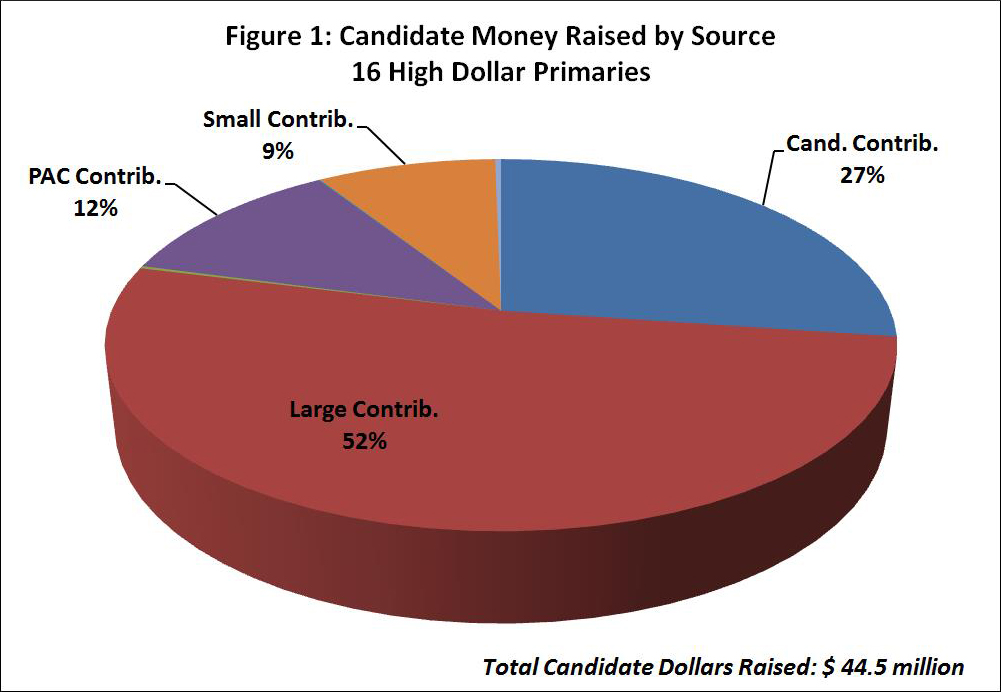
Candidates in the 16 examined races raised a combined $44.5 million in the first quarter. Large contributors, those who gave more than $200, account for the majority of candidate fundraising, 52 percent (see Figure 1). Candidates who self-financed their race account for over one-quarter of the combined fundraising total. PAC contributions and small individual contributions account for 12 and 9 percent respectively. Unsurprisingly, since these are primary races that will determine the party’s nominee, party spending is virtually nonexistent.
Of the 16 races that satisfied our criteria of high fundraising by viable candidates, most are Republican primaries; only four are Democratic contests. Of the primaries in our sample that feature a challenge to an incumbent, four are Republican and two are Democratic. Among the Republican primaries, two-thirds feature candidates identified as Tea Party favorites, consonant with the widespread expectation that Tea Party sentiment will be an important factor in the midterms.[2] Money has not been quick to flow to Tea Party candidates, however. In all but two of those eight contests, the Tea Party candidate has been significantly outraised (see Appendix). Examining only the four Tea Party races where candidate self-financing was less than 30 percent of the total raised, Tea Party candidates on average were outraised by a margin of almost 2 to 1, with Tea Party favorites raising just over $650,000 on average and other candidates raising almost $1.2 million on average.[3]
Small Contributors
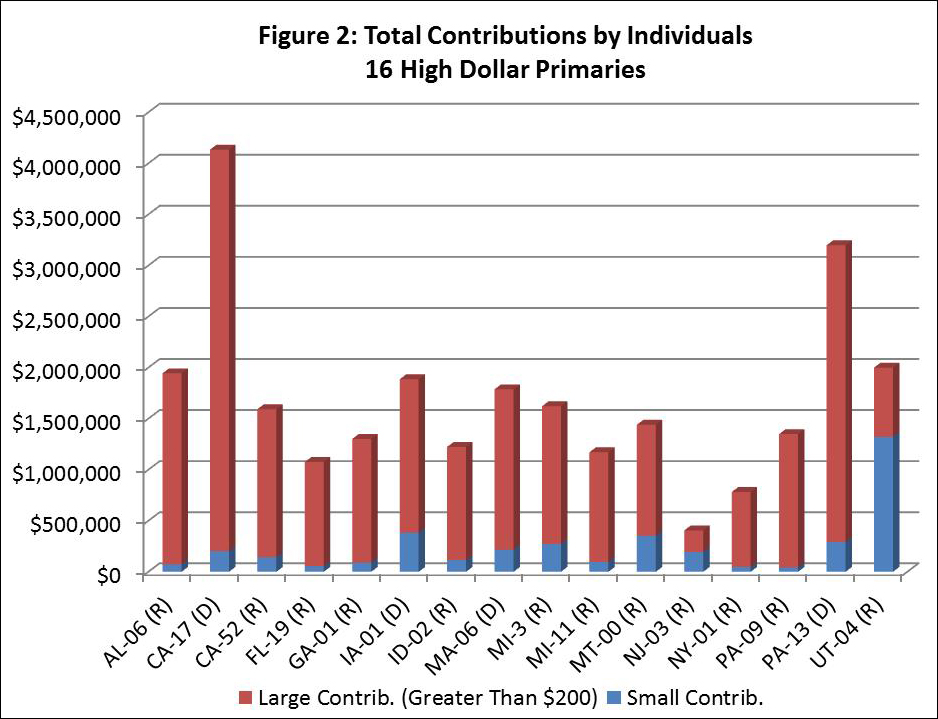
Of the 16 races analyzed in this brief, small contributions made up a minor portion of aggregate fundraising in each race through the end of March (see Figure 2). We define small contributions as those from donors of $200 or less, and classify all other individual contributions as large contributions.
Nine percent of candidate money came from small contributors, dwarfed by large donations. This is consistent with the percentage of small contributions to House races for the past several election cycles. One exception was Utah District 4, where small contributions account for approximately 55 percent of candidate funds. This is driven almost entirely by Republican Mia Love, who raised an impressive $1.3 million from contributors of $200 or less. Overall, Mia Love raised seven times more than her opponent in the first quarter and went on to win the nomination at the state convention.
Candidate Self-Financing
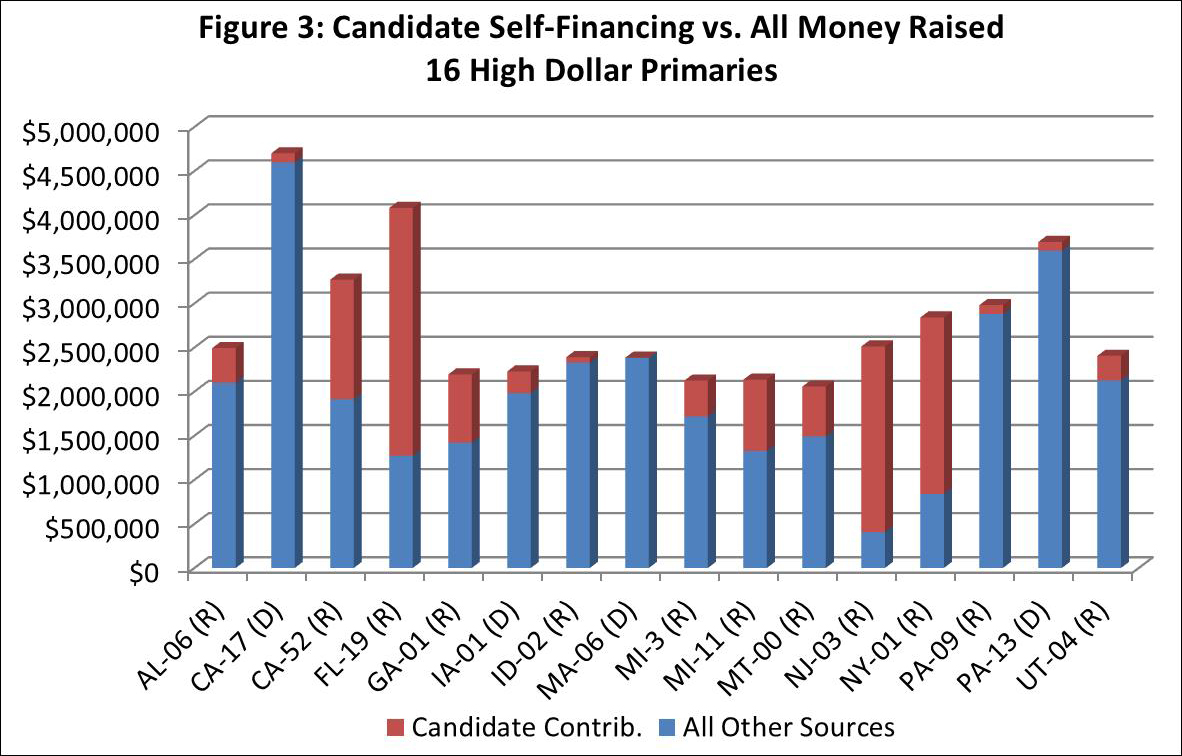
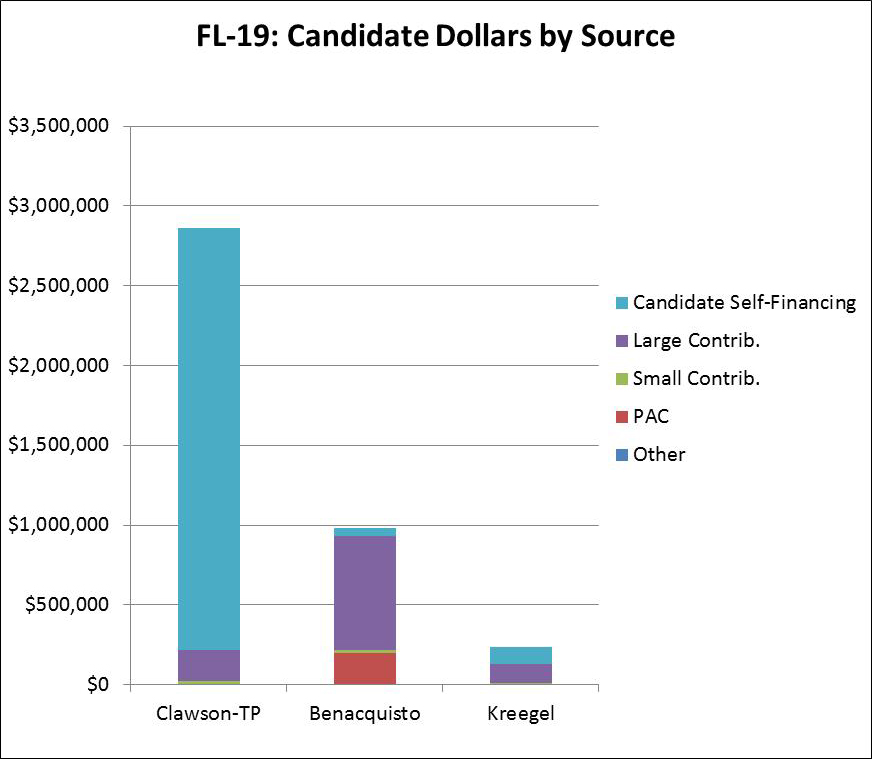
In several of the races we examined, candidates are in large part funding their own campaigns — in some cases to a striking degree (see Figure 3). As noted, across all 16 races, 27 percent of funds come from the candidates themselves in the first quarter. In the 16 high-dollar primaries, 12 candidates have spent $200,000 or more on their own bids. Four candidates expended more than $1 million on their campaigns. In the Florida District 19 race, Tea Party candidate Curt Clawson put up more than $2.6 million of his own money and went on to win the nomination.
The importance of self-financing across these races illustrates the unique ability of wealthy individuals to pass the barriers to entry into viable candidacy. The amount we report for candidate self-financing includes both contributions from candidates to their own campaigns and loans from candidates to their campaigns. Of course, loans may eventually be paid back. But for a candidate to be able to loan a campaign a large amount of money even in the short term requires significant financial resources.
II. Independent Spending
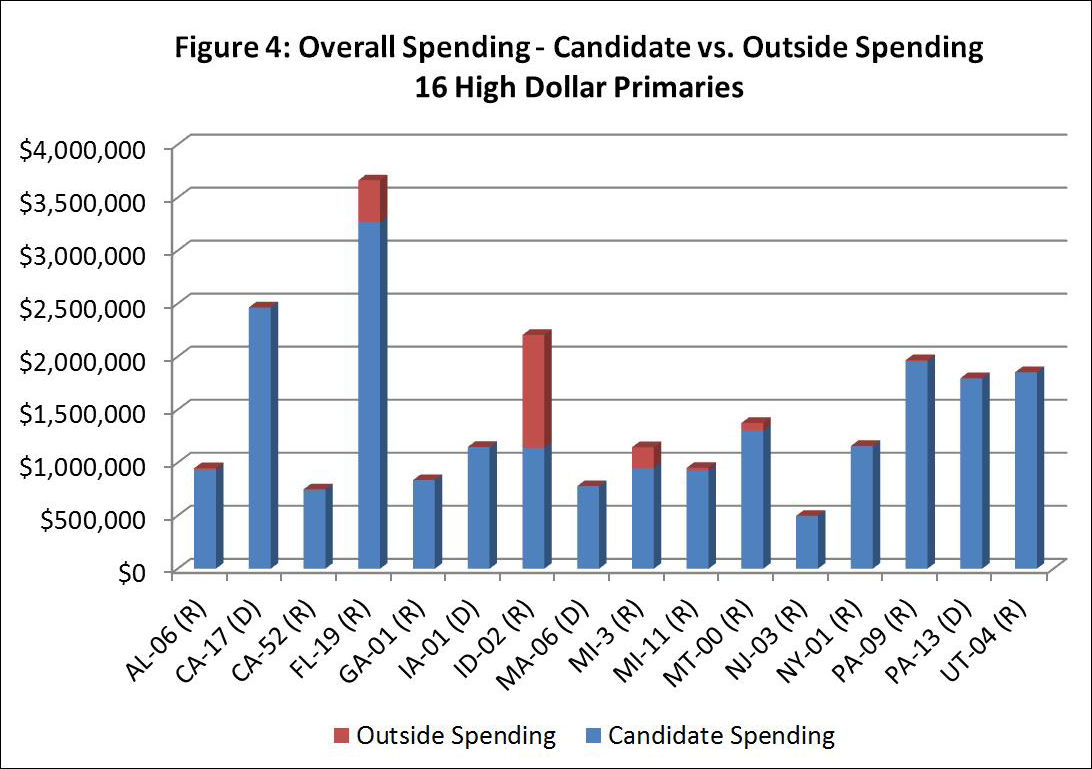
Across the 16 high-dollar House primaries, outside spending totaled $1.8 million, accounting for 8 percent of all spending through the end of March. This spending was not evenly distributed across all races, however (see Figure 4). The analysis of independent expenditures is based on the Brennan Center’s review of data files from the Sunlight Foundation, examining total expenditures that have been reported to the FEC.
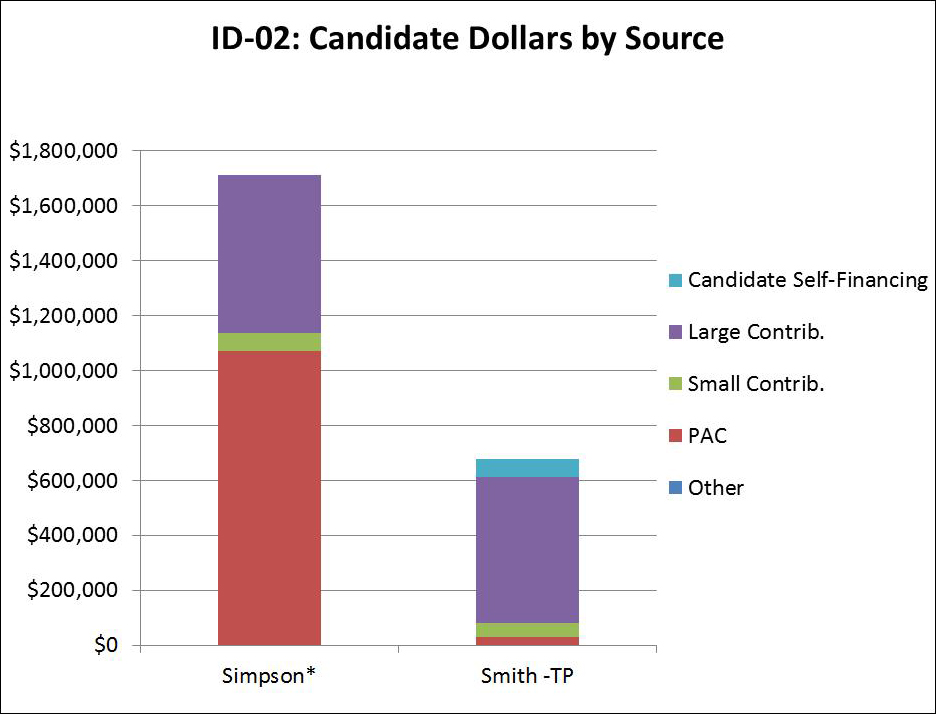
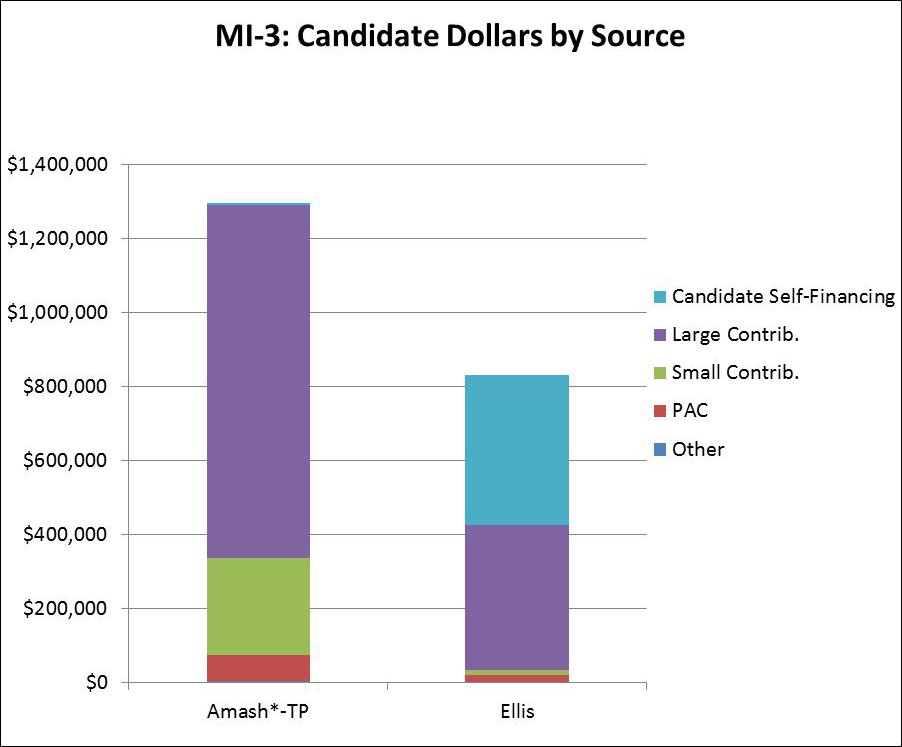
Three races — ID-02, FL-19 and MI-03 — attracted most of the outside spending in the first quarter. In the Idaho contest, outside spending accounted for just under half of all spending (48 percent). The independent spending in Idaho’s 2nd District reflects the divide between Tea Party and establishment Republicans, with business groups spending in favor of the incumbent Mike Simpson and Tea Party groups supporting challenger Bryan Smith. Independent expenditures accounted for 17 percent of spending in Michigan’s 3rd District, where they all favored Tea Party incumbent Justin Amash or attacked his opponent. Outside spending comprised approximately 11 percent of spending in Florida’s 19th, where the leading candidates all had their own candidate-specific outside money groups.
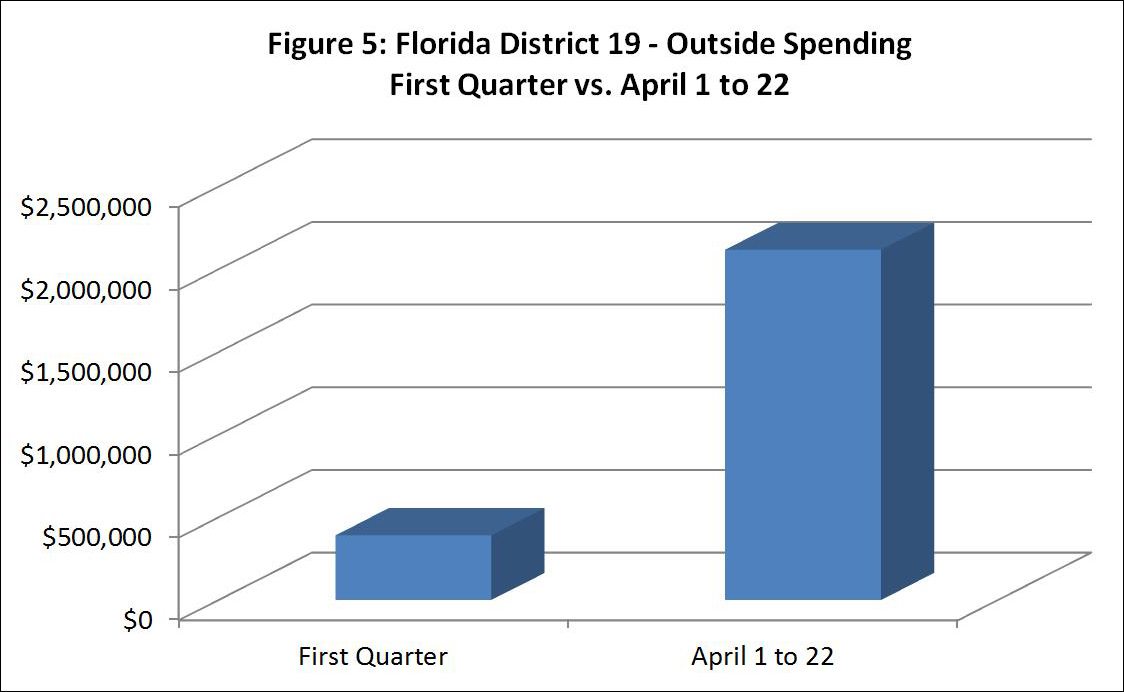
However, in recent election cycles, independent expenditures have peaked in the weeks immediately preceding the election, so for most contests there will likely be more of such spending next quarter, as we get closer to the primary elections themselves. Since independent expenditure filings are more frequent than campaign filings, we were able to analyze outside spending in the beginning of the second quarter. In FL-19, where the primary was held on April 22, there was $2 million in outside spending in the three weeks before the election (this spending is not included in Figure 4, because it came after the end of the first quarter). That was more than five times the amount of independent expenditures prior to that point (see Figure 5).
As noted, the outside spending totals in our analysis count only expenditures reported to the FEC. It is possible there have been significant outside expenditures in these races on sham issue ads, which stop short of calling for a vote for or against a candidate. Only express advocacy — meaning explicit calls to vote for or against a candidate — must be reported to the FEC. Sham issue ads, which praise or attack a candidate without using the “magic words” of express advocacy, are not reported and so are not counted in our analysis. Therefore, the spending totals cited in this issue brief understate the actual amount of outside spending thus far in the election cycle.
For example, the spending total reported here for Michigan’s 3rd District — one of the top races for outside spending — does not include significant spending on at least one issue ad. Election spending heavyweight Americans for Prosperity put out ads supporting Tea Party incumbent Justin Amash. The group announced in February that it would spend about $230,000 praising the incumbent. Because the ads don’t mention votes but only ask viewers to call Amash and thank him for fighting against Obamacare, they were not required to be reported to the FEC. Similarly, there were unreported expenditures in ID-02.
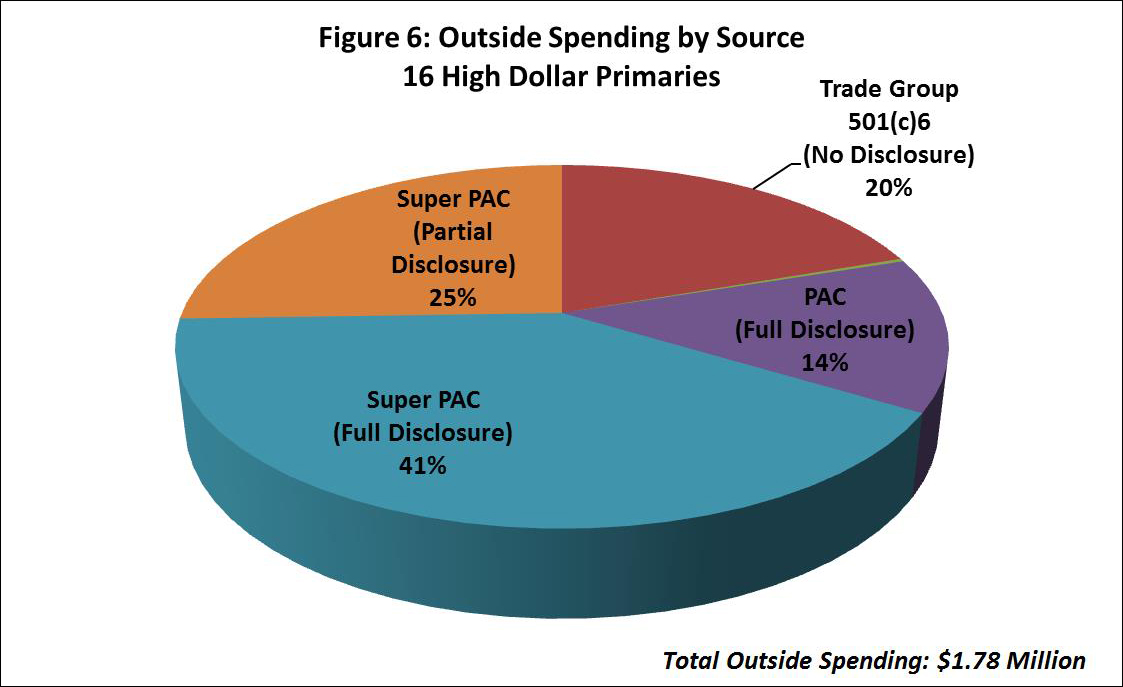
Even for spending that is reported, however, there is less than full transparency. Independent spenders have ways of hiding the sources of their money. Nonprofit 501(c) entities, like trade associations and “social welfare” groups, are not required to disclose their donors at all. In the first quarter, the spending of one such group in the Idaho District 2 primary, the U.S. Chamber of Commerce, accounted for one-fifth of outside spending across all 16 high-dollar primaries (see Figure 6).
PACs and super PACs are required to disclose their donors. Together, they account for about 80 percent of first-quarter outside spending, although as noted, significant outside spending appeared in only a handful of races. However, super PACs have the ability to shield their donors’ identities by accepting money from organizations that do not report their donors. For example, the organizers of a super PAC may also create an affiliated nonprofit organization. The group then solicits secret donations to the nonprofit, and the nonprofit makes a donation to the super PAC. On its FEC reports, the super PAC lists only the name of the nonprofit, not the ultimate source of the money. To capture this, Figure 6 breaks out super PACs that only partially disclose their donors according to the Center for Responsive Politics; these partial disclosers account for over one-quarter of outside spending through March. Adding in the dark money groups that disclose none of their donors shows that the spending for which there is inadequate disclosure accounts for 45 percent of independent expenditures.
Finally, the phenomenon of single-candidate super PACs, where an organization devotes all of its outside spending to supporting one candidate or attacking his or her opponents, appears in our sample. These single-candidate spenders, in some cases run by individuals with connections to the candidate, make a mockery of contribution limits, as convincingly argued by Columbia Law Professor Richard Briffault. After the large role that candidate-specific super PACs played in the 2012 presidential election, there was speculation that the influence of such groups would continue to grow, particularly in congressional contests; our analysis yields evidence that this prediction may be coming true.
Across all 16 races, 23 percent of outside spending came from single candidate groups. However, this is driven entirely by the FL-19 primary, where virtually all the independent expenditures came from single-candidate groups. In that race, several of the individuals who made six-figure contributions to candidate-specific super PACs also gave the maximum contribution to their favored candidate’s primary campaign. This phenomenon illustrates the concern that these groups can be used to circumvent individual base limits on contributions. In the coming days, we will release a case study of this race that illustrates the role of candidate-specific organizations in elections.
Conclusion
This analysis shows the continuing impact of Citizens United v. FEC and other important Supreme Court campaign finance decisions on political spending in Congressional races, from the way wealthy individuals use their own money to support their candidacies to the ability of donors to circumvent contribution limits through single-candidate super PACs.
The role of big money in American politics continues to evolve. This month, the Supreme Court changed the rules again with its decision in McCutcheon. The case will undoubtedly have an impact on how much money candidates raise and where they raise it from. Some have speculated that the decision will allow more money to flow to the parties and may begin to dry up outside spending. Chief Justice John Roberts was optimistic that ending aggregate limits will not make the base contribution limits meaningless by allowing donors to circumvent them through transfers among committees. Next quarter’s campaign finance filings will likely begin to answer questions about the effects of the decision. The amount and importance of transfers between candidates, joint fundraising committees, and leadership PACs after McCutcheon will be focuses of our future empirical investigation. Neither constitutional interpretation nor policy plans should be drawn up in a vacuum, lacking the benefit of evidence about how the funding of elections actually works.
Throughout the 2014 election cycle, the Brennan Center will continue to examine the ways that money influences politics to inform decisions about how to make democracy work for all of us.
Appendix
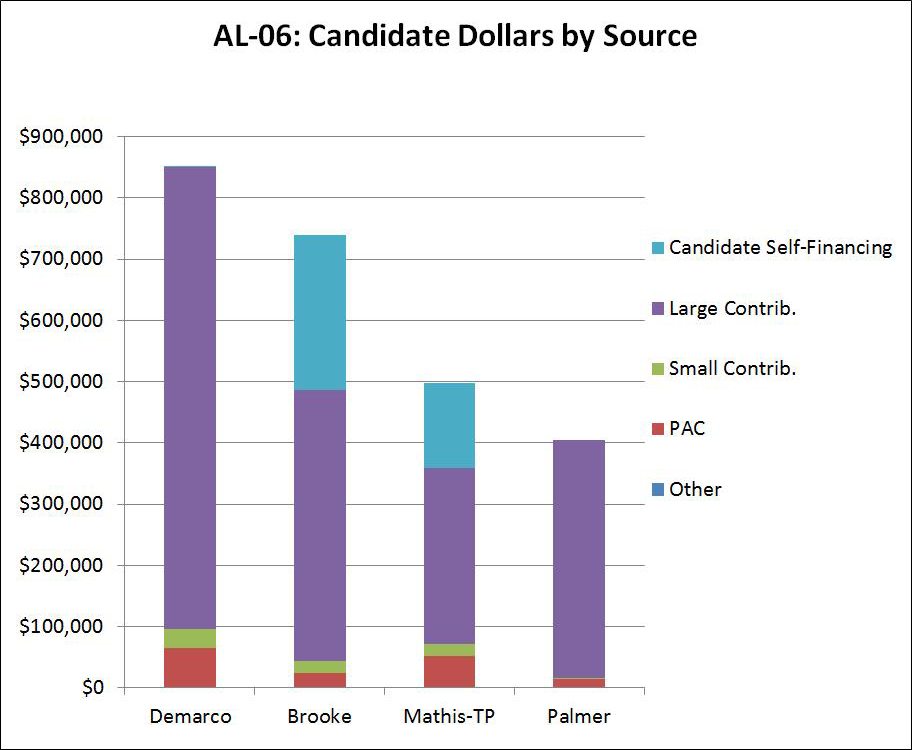
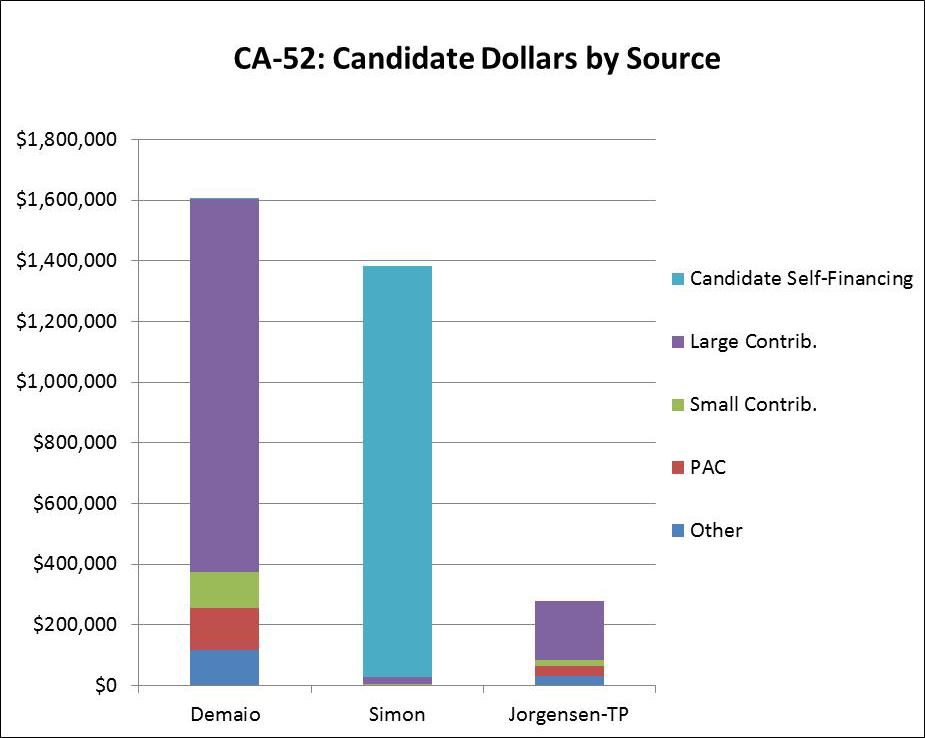
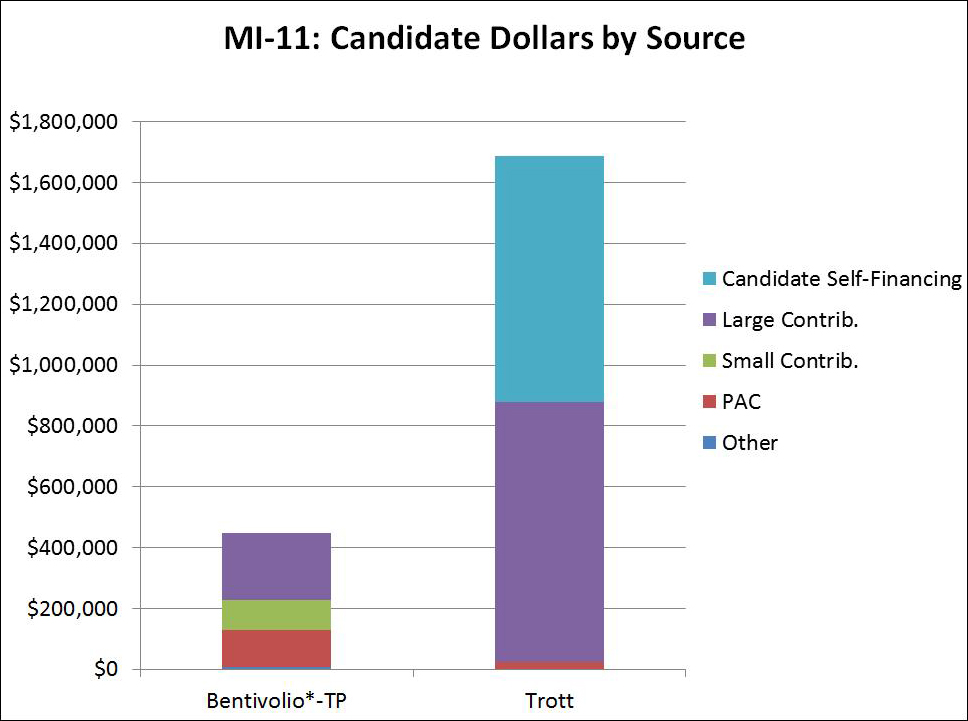
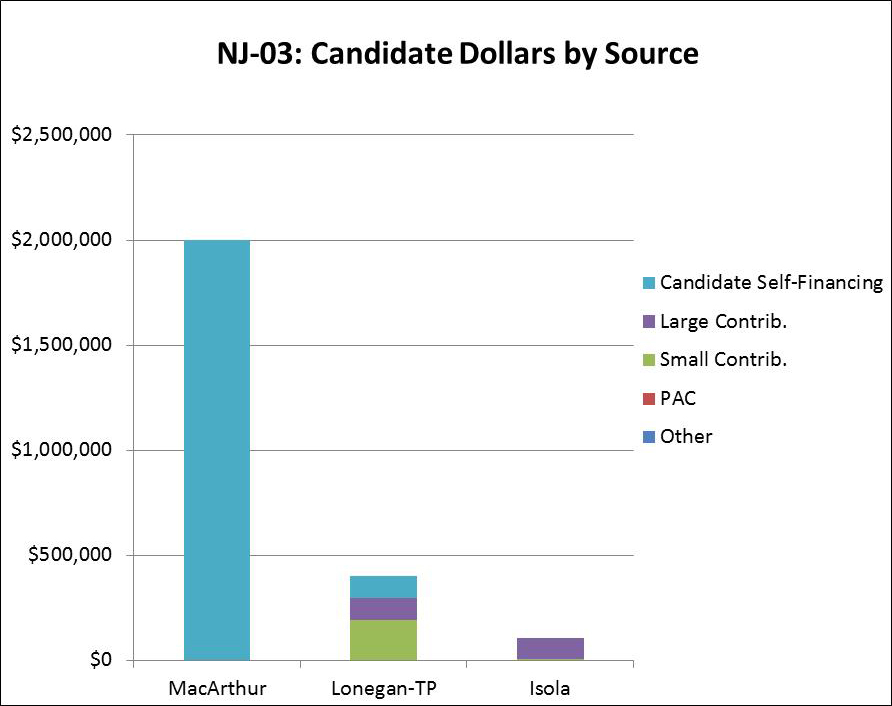
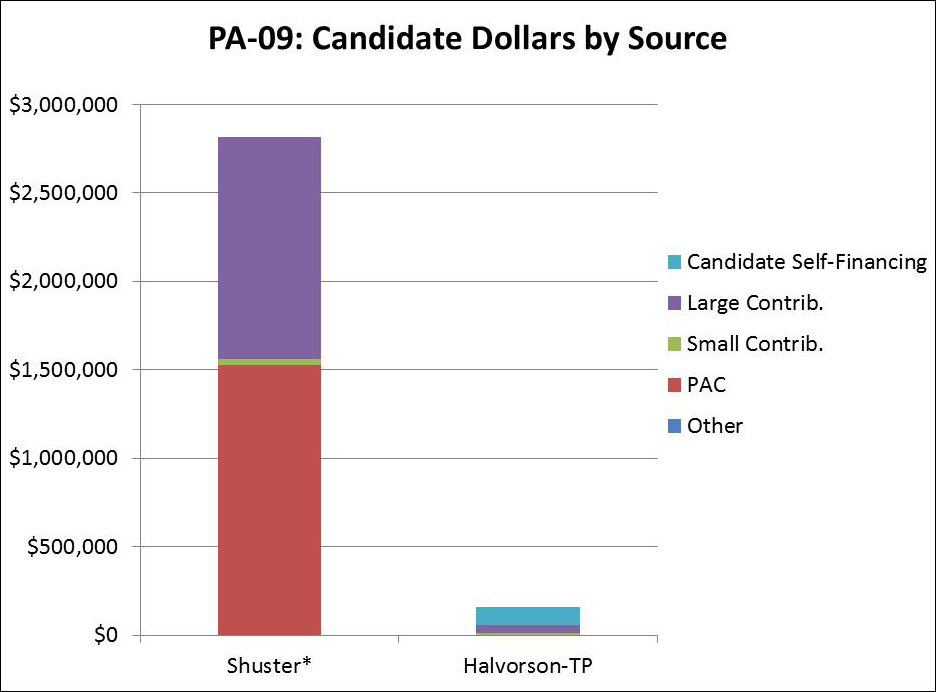
The following charts highlight spending patterns in the eight Republican primaries with Tea Party candidates. Tea Party candidates are denoted by a “TP” following a candidate’s name, and incumbents are denoted by an asterisk.
[1] This analysis is specific to the House primaries included on the Sunlight Foundation’s list of competitive primaries, available here. We confirmed our analysis by checking data from the Center for Responsive Politics. The Brennan Center has identified at least two races with “viable” candidate funds exceeding $2 million that were not on Sunlight’s list: CA-33 and VA-08. These races, respectively, had 6 and 8 candidates in the primary contests in question.
[2] In AL-06, Chad Mathis has secured Tea Party endorsements and outside spending. In CA-52, Kirk Jorgensen has been connected with the Tea Party and picked up PAC support from a Tea Party group. In FL-19, Curt Clawson was considered the Tea Party candidate. In ID-02, Bryan Smith is mounting a Tea Party challenge to an establishment incumbent. In MI-03, Tea Party incumbent Justin Amash has picked up an establishment challenger. In MI-11, another Tea Party incumbent, Kerry Bentivolio, is facing a business-friendly challenger. In NJ-03, Steve Lonegan is the Tea Party favorite. In PA-09, Art Halvorson is making a Tea Party-backed run against a well-established incumbent.
[3] The four primaries included in these averages are: AL-06, ID-02, MI-03 and PA-09.